
7-9-18 Market Update
The very big picture:
In the “decades” timeframe, the current Secular Bull Market could turn out to be among the shorter Secular Bull markets on record. This is because of the long-term valuation of the market which, after only eight years, has reached the upper end of its normal range.
The long-term valuation of the market is commonly measured by the Cyclically Adjusted Price to Earnings ratio, or “CAPE”, which smooths out shorter-term earnings swings in order to get a longer-term assessment of market valuation. A CAPE level of 30 is considered to be the upper end of the normal range, and the level at which further PE-ratio expansion comes to a halt (meaning that increases in market prices only occur in a general response to earnings increases, instead of rising “just because”).
Of course, a “mania” could come along and drive prices higher – much higher, even – and for some years to come. Manias occur when valuation no longer seems to matter, and caution is thrown completely to the wind as buyers rush in to buy first and ask questions later. Two manias in the last century – the 1920’s “Roaring Twenties” and the 1990’s “Tech Bubble” – show that the sky is the limit when common sense is overcome by a blind desire to buy. But, of course, the piper must be paid and the following decade or two are spent in Secular Bear Markets, giving most or all of the mania gains back.

See Fig. 1 for the 100-year view of Secular Bulls and Bears. The CAPE is now at 32.80, up from the prior week’s 32.30, and exceeds the level reached at the pre-crash high in October, 2007. This value is in the lower end of the “mania” range. Since 1881, the average annual return for all ten year periods that began with a CAPE around this level have been in the 0% – 3%/yr. range. (see Fig. 2).

In the big picture:
The “big picture” is the months-to-years timeframe – the timeframe in which Cyclical Bulls and Bears operate. The U.S. Bull-Bear Indicator (see Fig. 3) is in Cyclical Bull territory at 67.85, down from the prior week’s 67.98.

In the intermediate and Shorter-term picture:
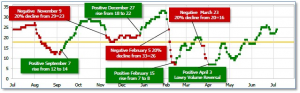
The Shorter-term (weeks to months) Indicator (see Fig. 4) turned positive on April 3rd. The indicator ended the week at 24, up from the prior week’s 22. Separately, the Intermediate-term Quarterly Trend Indicator – based on domestic and international stock trend status at the start of each quarter – was positive entering July, indicating positive prospects for equities in the third quarter of 2018.
Timeframe summary:
In the Secular (years to decades) timeframe (Figs. 1 & 2), the long-term valuation of the market is simply too high to sustain rip-roaring multi-year returns – but the market has entered the low end of the “mania” range, and all bets are off in a mania. The only thing certain in a mania is that it will end badly…someday. The Bull-Bear Indicator (months to years) is positive (Fig. 3), indicating a potential uptrend in the longer timeframe. In the intermediate timeframe, the Quarterly Trend Indicator (months to quarters) is positive for Q3, and the shorter (weeks to months) timeframe (Fig. 4) is positive. Therefore, with all three indicators positive, the U.S. equity markets are rated as Positive.
In the markets:
U.S. Markets: U.S. stocks were volatile during the holiday-interrupted week but finished predominantly on the upside. Continuing the pattern of recent weeks, both the technology-heavy NASDAQ Composite index and smaller-cap benchmarks outperformed. The Dow Jones Industrial Average added 185 points to close at 24,456, up 0.8% for the week. The NASDAQ Composite rebounded from last week’s decline, rising 2.4% to 7,688. By market cap, the large cap S&P 500 index gained 1.5%, while the mid cap S&P 400 index added 1.9% and the small cap Russell 2000 surged 3.1%.
International Markets: Canada’s TSX rebounded 0.6%, while across the Atlantic the United Kingdom’s FTSE fell a second week, down -0.3%. On Europe’s mainland major markets finished green. France’s CAC 40 rose 1.0%, Germany’s DAX added 1.5%, and Italy’s Milan FTSE gained 1.4%. In Asia, China’s Shanghai Composite continued its decline, dropping another -3.5%, while Japan’s Nikkei ended down -2.3%. As grouped by Morgan Stanley Capital International, developed markets finished the week up 0.9%, while emerging markets rebounded a slight 0.2%.
Commodities: Precious metals were mixed last week as Gold managed a slight 0.1% gain to finish the week at $1255.80 an ounce, while Silver was off -0.8% closing at $16.07. Oil had its first down week in three as West Texas Intermediate crude oil declined half a percent and ended the week at $73.80 per barrel. In what may be a concern going forward, the industrial metal copper had its fourth week of significant declines, dropping -4.8%. Copper prices are seen by some analysts as an indicator of global economic health due to its wide variety of industrial uses, and its price movements are thought to provide insight into global industrial production.
U.S. Economic News: The U.S. added 213,000 jobs in June, another healthy gain that shows companies are still eager to fill open positions despite the dwindling pool of available workers. The gain exceeded economists’ forecasts of an increase of 200,000. However, in a bit of a paradox the unemployment rate actually rose 0.2% to 4% after hitting an 18-year low in May. The jobless rate rose due to more than 600,000 workers re-joining the labor force, in another sign of the health of the labor market. The shrinking pool of labor is slowly forcing companies to raise pay as the competition for talent intensifies, but they are still managing to keep labor costs down. In the details of the report, white-collar professional firms filled 50,000 jobs last month to lead the way in hiring. Manufacturers, health-care providers, and construction companies rounded out the other big gainers with 36,000, 25,000, and 13,000 new jobs added, respectively. The only segment of the economy to reduce employment was retail, where companies shed 22,000 jobs after hiring 25,000 workers in the prior month.
Initial claims for new unemployment benefits hit a 6-week high last week but remained near their lowest levels in decades. The Labor Department reported that initial jobless claims rose by 3,000 to 231,000, exceeding economists’ forecasts of a 225,000 reading. The less volatile monthly average of claims increased by 2,250 to 224,500. Claims have remained under the 250,000 level for over nine months, signaling an extremely robust labor market. The number of people already receiving benefits, known as continuing claims, climbed by 32,000 to 1.74 million. That number is reported with a one-week delay.
Private-sector employment also remained solid last month, according to the latest data from private payroll processor ADP. ADP reported the private sector added 177,000 jobs in June, just slightly less than the 190,000 jobs economists had forecast. Details within ADP’s report showed that small firms added 29,000 positions, medium-sized businesses added 80,000, and large companies added 69,000. So far this year, employment gains have averaged 207,000 jobs per month. Mark Zandi, chief economist at Moody’s Analytics, stated he believes the U.S. unemployment rate is heading to the low 3% range— a stunningly low level that would be the lowest since the Korean War.
American manufacturers grew at their fastest pace in four months in June but report they’re running into trouble getting supplies delivered on time due to transportation bottlenecks, according to the Institute for Supply Management (ISM). The ISM manufacturing index rose to 60.2 last month, up 1.5 points from May. That matches the second highest level of the current economic expansion that began in mid-2009. The index hit a 14-year high in February. In the details of the report, new orders and employment remained strong, while supplier deliveries rose to a 14-year high. Ian Shepherdson, chief economist at Pantheon Macroeconomics summed up the report simply, “In one line: strong growth, but supply chains are stretched.”
In the services sector, most companies saw a pickup in business last month according to the ISM non-manufacturing index. The non-manufacturing index rose 0.5 points to 59.1 in June, beating market forecasts of 58.3. June’s reading was the highest since February as business activity and new orders rose faster and price pressures eased. Numbers over 50 are viewed as positive for the economy, while anything over 55 is considered exceptional. In the details, both production and new orders increased in June, and employment remained strong. The services sector, which includes professional services, healthcare and other non-manufacturing industries, makes up about 80% of US gross domestic product (GDP).
The Commerce Department reported that new orders for U.S.-made goods rose in May, as strong demand for machinery drove order numbers higher. Factory goods orders increased 0.4% in May and data for April was revised upward to just a 0.4% decrease, halving the 0.8% decline previously reported. Manufacturing, which accounts for about 12% of the U.S. economy, is being boosted by strong domestic and global demand but growing shortages of workers as well as import tariffs are starting to weigh on the supply chain. The Trump administration has imposed tariffs on a range of imported goods, including steel and aluminum, to protect domestic industries from what it says is unfair competition from foreign manufacturers.
Construction spending edged up 0.4% in May according to the latest data from the Commerce Department. The uptick in May brought total construction spending to a seasonally-adjusted all-time high of $1.31 trillion—4.5% higher than a year ago. In the details, total private construction rose 0.3% with residential projects up 0.8% in May. New single-family home construction rose 0.6%, while the volatile multi-unit sector, i.e. apartments and condominiums, jumped 1.6%. Economists are forecasting that construction spending will contribute to overall growth this year even though interest rates are rising. Jennifer Lee, senior economist for BMO Capital Markets, however wasn’t impressed. She noted the 0.4% increase in June missed expectations of a 0.6% rise, and that April’s number was revised down from 1.8% to just 0.9%.
International Economic News: Strong job growth returned to Canada where its economy added 31,800 jobs in June, according to Statistics Canada. In addition to the new jobs, Canada’s wage growth remained healthy and more people entered the workforce. Compared with a year earlier, overall employment was up 1.2%. In the details, Canada added 9,100 full-time jobs and 22,700 part-time positions. Frances Donald, senior economist at Manulife Asset Management stated, “This report was more than enough to seal the deal on a July rate hike from the Bank of Canada.” The Bank of Canada is set to make an interest rate decision this week, and a hike is widely expected.
Governor of the Bank of England Mark Carney now has more confidence in the United Kingdom’s economy saying recent data had given him “greater confidence” and that weak first-quarter growth “was largely due to the weather.” In a speech at the Northern Powerhouse Summit in Newcastle, Mr. Carney said: “Overall, recent domestic data suggest the economy is evolving largely in line with the May Inflation Report projections, which see demand growing at rates slightly above those of supply and domestic cost pressures building.” Carney’s view is supported by the recent IHS Markit services sector survey that showed stronger than expected activity last month. IHS Markit’s chief economist, Chris Williamson, said the improvement shown by the service sector, which accounts for just under 80% of the UK’s GDP, suggested the economy would expand by 0.4% in the second quarter – low, but double its rate of growth between January and March.
Helene Baudchon, research analyst at BNP Paribas, stated the “growth has peaked” in France – Europe’s third-largest economy. Baudchon stated based on her analysis the French economy “has moved out of the recovery phase and growth has peaked, although it is not showing the signs of overheating that typically mark the end-of-cycle period.” Concluding, she wrote “The economy seems to be in the intermediary growth phase, during which the economy slows but continues to grow at a faster pace than the potential growth rate.”
The International Monetary Fund (IMF) cut Germany’s 2018 economic growth forecast to 2.2%, saying rising protectionism and the threat of a hard Brexit expose Germany’s economy to significant short-term risks. While downgrading Germany’s 2018 forecast from 2.5% in April, the IMF raised its 2019 forecast to 2.1% from 2.0%. “Short-term risks are substantial, as a significant rise in global protectionism, a hard Brexit, or a reassessment of sovereign risk in the euro area, leading to renewed financial stress, could affect Germany’s exports and investment,” it said in a report. Given Germany’s rapidly aging society, IMF directors recommended further expanding public investment in infrastructure and education as well as setting more incentives for private investments. “Such measures would bolster productivity growth, further lift long-term output, and reduce Germany’s large current account surplus,” it said.
A Reuters poll showed China’s second-quarter economic growth is expected to have slowed slightly from the previous quarter as the government’s efforts to tackle debt risks weigh on activity and a looming trade war with the U.S. threatens exports. The economy has already felt the pinch from a multi-year crackdown on riskier lending that has driven up corporate borrowing costs, forcing the central bank to pump out more cash by cutting reserve requirements for lenders. The poll of 55 economists showed growth in gross domestic product likely eased a tick to 6.7% in the second quarter from the same time a year earlier. “The synchronized slowdown in domestic and external demand is likely to put pressure on economic growth in the second half,” said Lian Ping, chief economist at Bank of Communications. Lian said he expected GDP growth to slow to 6.6 percent in the third quarter and stay steady in the fourth quarter, bringing full-year growth to 6.7 percent – above the government’s target of around 6.5 percent.
Following a long recovery backed by robust overseas economies, Japan’s economy is also seen leveling off amid headwinds from growing global trade tensions as well as rising energy prices and domestic labor shortages. In the Bank of Japan’s latest quarterly Tankan survey, the headline business confidence diffusion index for large manufacturers came in at 21, down from 24 the previous quarter. The decline was the second consecutive fall for the first time since Prime Minister Shinzo Abe came to power in 2012. The survey results came on top of the government’s recent revised gross domestic product report, which showed that the Japanese economy shrank at an annualized rate of 0.6% in January-March, the first contraction in nine quarters. Finance Minister Taro Aso downplayed concerns about a stall in the economic recovery. The Tankan results were “not bad as a whole,” Aso claimed.
Finally: Analysts are beginning to take note of a concerning development in the market— extremes in market turnover. Trading is through the roof in many major market indexes and across asset classes. In the S&P 500 index alone, investors traded more than $2.9 trillion worth of shares since the beginning of the year—a level last seen in early 2008, right before the financial crisis really hit. JP Morgan Chase strategist Nikolaos Panigirtzoglou wrote in a note, “Market turnover tends to be high when uncertainty is high, as institutional investors continuously reshuffle their portfolios. Negative growth revisions coupled with political and policy risks including the Italian crisis and trade war risks are creating a lot more uncertainty this year relative to last year.”

(sources: all index return data from Yahoo Finance; Reuters, Barron’s, Wall St Journal, Bloomberg.com, ft.com, guggenheimpartners.com, zerohedge.com, ritholtz.com, markit.com, financialpost.com, Eurostat, Statistics Canada, Yahoo! Finance, stocksandnews.com, marketwatch.com, wantchinatimes.com, BBC, 361capital.com, pensionpartners.com, cnbc.com, FactSet; Figs 1-5 source W E Sherman & Co, LLC)
These are the opinions of WE Sherman and Co and not necessarily those of Cambridge, are for informational purposes only, and should not be construed or acted upon as individualized investment advice.
Securities offered through Registered Representatives of Cambridge Investment Research Inc., a broker-dealer, member FINRA/SIPC. Advisory Services offered through Cambridge Investment Research Advisors, a Registered Investment Adviser. Strategic Investment Partners and Cambridge are not affiliated.
Indices mentioned are unmanaged and cannot be invested into directly. Past performance is no guarantee of future results. All Investing involves risk. Depending on the types of investments, there may be varying degrees of risk. Investors should be prepared to bear loss, including total loss of principal.