
7-12-21 Weekly Market Update
The very Big Picture
The long-term valuation of the market is commonly measured by the Cyclically Adjusted Price to Earnings ratio, or “CAPE”, which smooths-out shorter-term earnings swings in order to get a longer-term assessment of market valuation. A CAPE level of 30 is considered to be the upper end of the normal range, and the level at which further PE-ratio expansion comes to a halt (meaning that further increases in market prices only occur as a general response to earnings increases, instead of rising “just because”). The market was recently at that level.
Of course, a “mania” could come along and drive prices higher – much higher, even – and for some years to come. Manias occur when valuation no longer seems to matter, and caution is thrown completely to the wind – as buyers rush in to buy first, and ask questions later. Two manias in the last century – the “Roaring Twenties” of the 1920s, and the “Tech Bubble” of the late 1990s – show that the sky is the limit when common sense is overcome by a blind desire to buy. But, of course, the piper must be paid, and the following decade or two were spent in Secular Bear Markets, giving most or all of the mania-gains back.
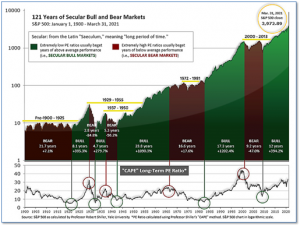
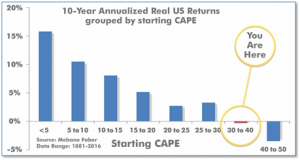
See Fig. 1 for the 100-year view of Secular Bulls and Bears. The CAPE is now at 38.36, up from the prior week’s 38.21. Since 1881, the average annual return for all ten-year periods that began with a CAPE in the 30-40 range has been slightly negative (see Fig. 2).
Note: We do not use CAPE as an official input into our methods. However, if history is any guide – and history is typically ‘some’ kind of guide – it’s always good to simply know where we are on the historic continuum, where that may lead, and what sort of expectations one may wish to hold in order to craft an investment strategy that works in any market ‘season’ … whether current one, or one that may be ‘coming soon’!
The Big Picture:
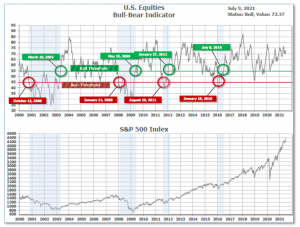
The ‘big picture’ is the (typically) years-long timeframe – the timeframe in which Cyclical Bulls and Bears operate. The U.S. Bull-Bear Indicator is in Cyclical Bull territory at 72.37 up from the prior week’s 71.29.
In the Quarterly- and Shorter-term Pictures
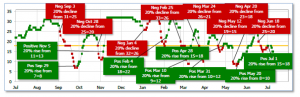
The Quarterly-Trend Indicator based on the combination of U.S. and International Equities trend-statuses at the start of each quarter – was Positive on June 30, indicating positive prospects for equities in the first quarter of 2021.
Next, the short-term(weeks to months) Indicator for US Equities turned positive on July 1 and ended the week at 15, down from the prior week’s 18.
In the Markets:
U.S. Markets: The major U.S. benchmarks closed the week mixed, with large caps and growth stocks outperforming for a second week. The Dow Jones Industrial Average finished the week up 84 points to 34,870, a gain of 0.2%. The technology-heavy NASDAQ Composite rose 0.4%. By market cap, the large cap S&P 500 gained 0.4%, while the mid cap S&P 400 and small cap Russell 2000 retreated -0.1% and -1.1%, respectively.
International Markets: International markets were likewise mixed on the week. Canada’s TSX rose 0.2%, while the United Kingdom’s FTSE 100 remained essentially flat. On Europe’s mainland, France’s CAC 40 retreated -0.4%, while Germany’s DAX rose 0.2%. In Asia, China’s Shanghai Composite ticked up 0.2%. The most notable move was in Japan where the Nikkei plunged -2.9% as a new lockdown was announced. As grouped by Morgan Stanley Capital International, developed markets rose 0.3%, while emerging markets declined -2.2%.
Commodities: Precious metals finished the week mixed. Gold gained 1.5% to $1810.60 per ounce, while Silver shed ‑1% to $26.23. Energy experienced its first down week in seven. West Texas Intermediate crude oil declined -0.8% to $74.56 per barrel. The industrial metal copper, viewed by some analysts as a barometer of global economic health due to its wide variety of uses, finished the week up 1.6%.
U.S. Economic News: The number of Americans applying for first-time unemployment benefits rose slightly last week, while layoffs remain near their pandemic lows. Initial jobless claims rose by 2,000 to 373,000 in the seven days ended July 3, the government reported. Economists had forecast new claims would fall to a seasonally adjusted 350,000. The number of people applying for state or federal benefits each week has fallen gradually this year, but claims are still more than double the pre-pandemic average. New claims averaged in the low 200,000s before the viral outbreak. Continuing claims, which counts the number of people already collecting state jobless benefits, fell by 145,000 to a seasonally adjusted 3.34 million. That number is reported with a one-week delay.
The number of jobs available in the United States hit a record last month as businesses still can’t find enough qualified workers to fill them. The Labor Department reported job openings in the U.S. rose slightly to a record 9.21 million. The number of available jobs has set a record for three consecutive months. Not only that, but a record 4 million people quit their jobs two months ago, nearly double the number from the same time a year earlier. “People are moving from one job to the next,” said Anthony Nieves, chairman of a monthly survey of service-oriented companies that asks how business is going. The closely-watched “quits rate” among private-sector workers declined to 2.9% from a record 3.2%. The quits-rate is rumored to be the Federal Reserve’s preferred measure of the health of the labor market. At the height of the coronavirus crisis, the quits rate had fallen to a seven-year low of 1.8%.
The Institute for Supply Management (ISM) reported a drop in its services index in June, down from a record-high the previous month. ISM’s survey of service-oriented businesses fell to 60.1 in June, down from a record 64.0 in May. Restaurants, retailers, and other businesses that compose the huge services side of the U.S. economy reported they simply cannot find enough people to fill open jobs—or get the supplies they need to keep up with sales. These shortages are boosting the cost of materials and labor and adding to the upward pressure on prices. The reading missed economists’ expectations for a reading of 63.3. Senior U.S. economist Michael Pearce of Capital Economics stated, “Shortages and price increases are becoming an increasing drag on hiring and economic activity.”
Following two monetary-policy meetings in which there was virtually no discussion of slowing down asset purchases, the minutes from the Federal Reserve’s June meeting show officials dove into the debate about how and when to taper. Currently, the Fed is holding its policy interest rates close to zero and buying $120 billion in Treasuries and mortgage-backed securities each month to bolster the economy. The central bank said it would keep up the pace of purchases until “significant” progress was reached on the labor market and inflation. However, with inflation surging, many economists think it is time for the Fed to move. But there is concern that any move to the exit could set off an outsized market reaction as it did in 2013. The minutes show “various” officials said they thought the committee would meet the “significant further progress” condition to begin to reduce the pace of asset purchases “somewhat earlier” than they had anticipated. Fed-watchers noted that “various” wasn’t a term often used by the Federal Reserve and it was unclear whether it also meant the majority. At his last press conference, Powell said the Fed would go “meeting by meeting” and see if the conditions for tapering are met.
International Economic News: A Reuters poll of economists showed the majority believe the Bank of Canada will taper its asset purchasing program again at its July 14 meeting. After recording its steepest annual decline last year since quarterly data was first noted in 1961, Canada’s export-driven economy was forecast to grow 6.2% on average in 2021, the poll showed, marking the fastest annual expansion since 2007. Furthermore, the Bank of Canada’s latest Business Outlook Survey indicator rose to a record high, pointing to a broadening economic recovery. Sri Thanabalasingam, senior economist at TD Economics stated, “Canada got some good economic news to kick off the summer. The economy was not as hard hit from the third wave…as previously feared.” Among the Group of Seven central banks, the BoC was the first to tighten policy when it reduced its weekly asset purchases program in April.
Across the Atlantic, the British economy grew at a slower rate in May than economists had expected. The Office for National Statistics reported Britain’s economy grew 0.8% in May—below expectations of a 1.5% rise. Economists attributed the miss to a shortage of microchips impacting car production. Vehicle production had its biggest fall since the U.K. was first hit by lockdown measures last year. Car, truck and bus manufacturing output declined by 16.5% for the month. Economists are optimistic the UK’s economy will improve as its economy continued to reopen. The next easing of restrictions in England is due to take place on July 19. This will involve the lifting of all remaining lockdown restrictions that should further boost consumer-facing sectors.
On Europe’s mainland, French Finance Minister Bruno Le Maire said he still targeted economic growth of 5% this year and urged the French people to get the COVID vaccine. France has experienced a viral outbreak of the COVID “delta” variant. “We have an excellent economic situation and a worrying health situation. I would not want the health situation to compromise the economic situation,” Le Maire said. Le Maire’s comments were supported by Agnes Benassy-Quere, chief economist at the French Treasury, who reiterated the official forecast of 5% growth.
Economists at Germany’s ZEW Economic Research Institute lowered their expectations of future economic growth for a second consecutive month, but forecasts remained near historically high levels. ZEW’s measure of economic expectations decreased to 63.3 in July from 79.8 in June. The reading widely missed economists’ forecast of 75.0. Despite the fall, the financial market experts surveyed expect the overall economic situation to be extraordinarily positive in the coming six months, Achim Wambach, president of the ZEW institute, said. The assessment of the current economic situation in Germany continued to improve to 21.9 in July from minus 9.1 in June, the ZEW institute said. That reading was far higher than the consensus forecast of 8.0.
In Asia, economists from Nomura expect China’s economic growth to decelerate in the second half of the year due to softer export demand, property tightening measures, higher commodity prices and Beijing’s carbon neutral campaign. Last year, China enjoyed strong export growth given its key role as a global manufacturing center, with overseas demand for work from home products and personal protective equipment (PPE) surging while most countries were being ravaged by virus outbreaks. Lu Ting, Chief China Economist at Nomura wrote, “When developed economies reopen, their consumption of a lot of the PPE and work from home products will shift to services, but China’s export strength is not with the services but the goods.” In May, China’s exports grew by 27.9% compared with a year earlier. While that sounds exceptional, it was down from 43.1% in April.
Japan’s latest coronavirus state of emergency covering Tokyo, declared by the government Thursday, could cost the economy around 1 trillion yen ($9.1 billion), according to economists’ estimates. The government’s decision to place the Japanese capital under a fourth state of emergency and extend an emergency in the southern island prefecture of Okinawa will cut private consumption by 1.2 trillion yen, said Toshihiro Nagahama, chief economist at the Dai-ichi Life Research Institute. The latest emergency for Tokyo and the extension for Okinawa will take effect from Monday and last until Aug. 22, which would include the duration of the Olympics set to start on July 23. The emergency declaration followed a recent spike in coronavirus cases.
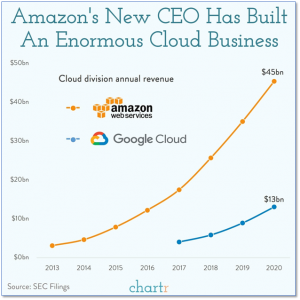
Finally: After 27 years at the helm of Amazon, founder Jeff Bezos officially stepped down as CEO. Taking his place is Andy Jassy. The reaction of most Americans was “Who?” Jassy ran Amazon’s cloud computing division, Amazon Web Services (AWS). During its growth, Amazon had become quite good at building and managing tech infrastructure services like databases, storage, and computing. In 2003, AWS was formed with its first products launching in 2006 under the leadership of Jassy. Amazon’s share of the cloud computing market isn’t just impressive—it is massive. Amazon’s AWS division rakes in more than 3X the amount of revenue as its next closest competitor, Google, and accounted for 63% of Amazon’s operating profit in 2020. (Chart from Chartr.co)
(Sources: All index- and returns-data from Yahoo Finance; news from Reuters, Barron’s, Wall St. Journal, Bloomberg.com, ft.com, guggenheimpartners.com, zerohedge.com, ritholtz.com, markit.com, financialpost.com, Eurostat, Statistics Canada, Yahoo! Finance, stocksandnews.com, marketwatch.com, wantchinatimes.com, BBC, 361capital.com, pensionpartners.com, cnbc.com, FactSet.) Securities offered through Registered Representatives of Cambridge Investment Research Inc., a broker-dealer, member FINRA/SIPC. Advisory Services offered through Cambridge Investment Research Advisors, a Registered Investment Adviser. Strategic Investment Partners and Cambridge are not affiliated. Indices mentioned are unmanaged and cannot be invested into directly. Past performance is no guarantee of future results.