
6-4-18 Market Update
The very big picture:
In the “decades” timeframe, the current Secular Bull Market could turn out to be among the shorter Secular Bull markets on record. This is because of the long-term valuation of the market which, after only eight years, has reached the upper end of its normal range.
The long-term valuation of the market is commonly measured by the Cyclically Adjusted Price to Earnings ratio, or “CAPE”, which smooths out shorter-term earnings swings in order to get a longer-term assessment of market valuation. A CAPE level of 30 is considered to be the upper end of the normal range, and the level at which further PE-ratio expansion comes to a halt (meaning that increases in market prices only occur in a general response to earnings increases, instead of rising “just because”).
Of course, a “mania” could come along and drive prices higher – much higher, even – and for some years to come. Manias occur when valuation no longer seems to matter, and caution is thrown completely to the wind as buyers rush in to buy first and ask questions later. Two manias in the last century – the 1920’s “Roaring Twenties” and the 1990’s “Tech Bubble” – show that the sky is the limit when common sense is overcome by a blind desire to buy. But, of course, the piper must be paid and the following decade or two are spent in Secular Bear Markets, giving most or all of the mania gains back.

See Fig. 1 for the 100-year view of Secular Bulls and Bears. The CAPE is now at 32.16, down slightly from the prior week’s 32.34, and still exceeds the level reached at the pre-crash high in October, 2007. This value is in the lower end of the “mania” range. Since 1881, the average annual return for all ten year periods that began with a CAPE around this level have been in the 0% – 3%/yr. range. (see Fig. 2).

In the big picture:
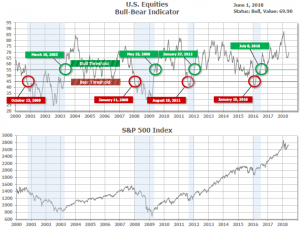
The “big picture” is the months-to-years timeframe – the timeframe in which Cyclical Bulls and Bears operate. The U.S. Bull-Bear Indicator (see Fig. 3) is in Cyclical Bull territory at 69.90, up from the prior week’s 68.41.
In the intermediate and Shorter-term picture:
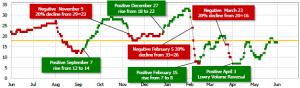
The Shorter-term (weeks to months) Indicator (see Fig. 4) turned positive on April 3rd. The indicator ended the week at 17, down from the prior week’s 19. Separately, the Intermediate-term Quarterly Trend Indicator – based on domestic and international stock trend status at the start of each quarter – was negative entering April, indicating poor prospects for equities in the second quarter of 2018.
Timeframe summary:
In the Secular (years to decades) timeframe (Figs. 1 & 2), the long-term valuation of the market is simply too high to sustain rip-roaring multi-year returns – but the market has entered the low end of the “mania” range, and all bets are off in a mania. The only thing certain in a mania is that it will end badly…someday. The Bull-Bear Indicator (months to years) is positive (Fig. 3), indicating a potential uptrend in the longer timeframe. In the intermediate timeframe, the Quarterly Trend Indicator (months to quarters) is negative for Q2, and the shorter (weeks to months) timeframe (Fig. 4) is positive. Therefore, with two indicators positive and one negative, the U.S. equity markets are rated as Neutral.
In the markets:
U.S. Markets: U.S. stocks finished the week modestly higher after recovering from a sell-off early in the week that was triggered by worries about Italy and the stability of the Eurozone. The Dow Jones Industrial Average finished the week down 117 points closing at 24,635, a loss of -0.5%. The technology-heavy NASDAQ Composite, however, followed last week’s 1% gain with a further 1.6%. Smaller cap stocks outperformed large caps as the small cap Russell 2000 and mid cap S&P 400 gained 1.3% and 0.6%, respectively, while the large cap S&P 500 rose a lesser but still respectable 0.5%.
International Markets: Canada’s TSX finished down for a second week, falling -0.2%. In Europe, the United Kingdom’s FTSE was off -0.4%, while on Europe’s mainland France’s CAC 40 retreated -1.4%, Germany’s DAX fell ‑1.7%, and Italy’s Milan FTSE ended down -1.3%. In Asia, China’s Shanghai Composite retreated a second week falling -2.1%, while Japan’s Nikkei ended down -1.2%. As grouped by Morgan Stanley Capital International, developed markets finished the week down -0.3%, while emerging markets were off -0.2%.
Commodities: Precious metals were mixed following last week’s gains. Gold fell -0.9% on the week while the often-more-volatile Silver rose 0.1%. Energy retreated for a second consecutive week giving up most of its recent gains as West Texas Intermediate crude oil fell -3.2% to $65.71 per barrel. The industrial metal copper, viewed by some analysts as a barometer of world economic health due its variety of industrial uses, rose 0.5%.
May Summary: May was a strong month for U.S. markets, with the Dow Jones Industrial Average adding 1.1% and the Nasdaq Composite surging 5.3%. By market cap, the large cap S&P 500 added 2.2%, the mid cap S&P 400 rose 4.0%, and the small cap Russell 2000 vaulted 5.9%. Canada’s TSX rose 2.9%, while in Europe the UK’s FTSE added 2.2%. Major markets on Europe’s mainland finished the month lower with France’s CAC 40 down -2.2%, Germany’s DAX off -0.1%, and Italy’s Milan FTSE plunging -9.2%. In Asia, China’s Shanghai Composite added 0.4% while Japan’s Nikkei retreated -1.2%. For the month, developed markets retreated -1.9%, and emerging markets fell -2.6%. Gold fell for a second consecutive month by slipping -1.6%, while silver managed a gain of 0.3%. Crude oil finished the month down -2.1%, and copper finished May off -0.3%.
U.S. Economic News: The number of people seeking new unemployment benefits dropped last week as the recent upturn in jobless claims ceased and layoffs remain at historic low levels. The Labor Department reported initial jobless claims fell by 13,000 to 221,000, below expectations of a 225,000 reading. The less-volatile monthly average of new claims rose slightly to 222,250. Layoffs remain near a 50-year low, and there’s no indication that they will reverse anytime soon. Economists estimate that jobless claims are likely to remain around the 220,000-level for the foreseeable future. The U.S. labor market continues to get stronger with unemployment below 4% for the first time since 2000 and job openings at a record high. Continuing claims, which counts the number of people already receiving unemployment benefits also dropped by 16,000 to 1.73 million.
Payroll processor ADP reported the U.S. added 178,000 private-sector jobs in May, an increase of 15,000 from last month. Hiring was spread across industries and company size, with medium-sized businesses (those with 50 to 499 employees) adding 84,000 jobs, large businesses adding 56,000 positions and small ones adding 38,000. By industry, 61,000 professional and business-services jobs were added, 39,000 new construction jobs, 35,000 education and health positions, and 33,000 leisure and hospitality jobs. As has been the case for over a year now, companies continued to report difficulty finding qualified candidates. In fact, the limited supply of solid job applicants is now the limiting factor in growth in the jobs market. Ahu Yildirmaz, vice president of ADP Research Institute noted, “The hot job market has cooled slightly as the labor market continues to tighten.”
The Labor Department’s monthly Non-Farms Payroll (NFP) report showed the U.S. created 233,000 new jobs in May, another strong gain that pushed the unemployment rate down to an 18-year low of 3.8%. The report signaled that the nine-year old economic expansion still continues despite being one of the oldest on record. The increase in hiring—the biggest in three months—exceeded economists’ expectations of only 200,000 new positions. By and large, the reported showed an economy with plenty of vigor. Most industries added jobs and worker pay increased at a somewhat faster pace. The last time the jobless rate was lower was in 1969.
The upward trajectory of home prices showed no signs of slowing down, according to the latest reading from the S&P/Case-Shiller national home price index. The Case-Shiller home price index rose a seasonally-adjusted 0.4% in March and was up 6.5% compared to the same time a year ago. The more narrowly focused 20-city index was up a seasonally-adjusted 0.5% and was 6.8% higher than the same time last year. Demand continues to be strong as supply is short and favorable economic conditions continue to make conditions in which bidders drive prices up. Of note, year-over-year gains in the 20-city index have been up every month since last June. In addition, the annual gain in the March report was the strongest since mid-2014. Home prices in Seattle continued to lead the way with a 13% increase over a year ago, followed by Las Vegas at 12.4% and San Francisco at 11.3%.
However, those high prices may now be putting a damper on home sales. The National Association of Realtors (NAR) index of pending home sales hit a three-month low in April, falling 1.3% to 106.4. The index tracks the number of real-estate transactions in which a contract has been signed, but not yet closed. The index is now lower than year-ago levels for the fourth consecutive month. Economists had expected a 0.4% increase. By region, pending sales were unchanged in the Northeast, but were down 3.2% in the Midwest. In the South and West, sales were down 1% and 0.4%, respectively. The NAR called the lack of homes for sale a “crisis” earlier in the year and there continues to be no relief in sight.
Purchasing Managers in the Chicago Federal Reserve’s region, which includes Illinois, Iowa, Indiana, Michigan, and Wisconsin, reported stronger business activity as the Chicago Purchasing Managers Index (PMI) surged 5.1 points to a reading of 62.7. The strength in the PMI was driven by acceleration in both output levels and orders. “Although broad based, the rise was largely thanks to a rebound in demand and back-to-back growth in output,” said Jamie Satchi, economist at MNI Indicators. While employment recovered from a six-month low, firms said they had continuing difficulty finding adequate workers. The reading was its highest level since January.
Manufacturing activity expanded at a faster pace than anticipated in May, according to the Institute of Supply Management (ISM). ISM’s manufacturing index jumped 1.4 points to 58.7, exceeding forecasts for a reading of 58.4. May also marked the 21st consecutive month of expansion for the manufacturing index, where numbers above 50 indicate activity is increasing. Tim Fiore, who oversees the ISM survey of factory purchasing and supply managers, stated the “really strong report was primarily driven by the fact that demand continues to stay high.” However, he noted there were worries over tariffs and possible trade disruptions among respondents. Forecasters and policy makers closely watch manufacturing, which accounts for about 12% of the nation’s economic output, for clues to the direction of the broader U.S. economy.
Confidence among the nation’s consumers remained near an 18-year high in May, suggesting the economy should continue to grow over at least the next few months. The Conference Board reported its Consumer Confidence index rose to 128 in May, up 2.4 points from April’s reading. In the details, the present situation index, a measure of how consumer’s feel about current conditions, hit a 17-year high of 161.7, while the future expectations index edged up 1.3 points to 105.6. Barclays released a note to clients stating, “Consumer confidence has remained resilient in recent months despite uncertainty stoked by anti-trade rhetoric and stock market volatility.” The confidence of the nation’s consumers is supported by data that shows their spending also surged for a second straight month. The Commerce Department reported spending on consumer goods rose 0.6% in April, following a 0.5% increase in March. The increase was the biggest amount since last November. Analysts note that the increases were widely expected as Americans benefitted from the recent tax-code overhaul that put more money in their pockets.
Along with spending, inflation likewise increased in April. The Federal Reserve’s preferred inflation gauge, the Personal Consumption Expenditures Price Index, rose 0.2%, as did the core rate, which strips out the volatile food and energy categories. The rate of inflation over the past year remained unchanged at 2%, while the core rate remained at 1.8%. With inflation near the Fed’s target of 2%, the Fed has room to pursue its current “gradualist” strategy of raising interest rates.
The Federal Reserve’s Beige Book, a collection of anecdotal information and current economic conditions from each of the district Federal Reserve Banks, said the U.S. grew “moderately” in late April to early May indicating that the central bank remains on track to raise interest rates again next month. Although companies have responded to the chronic shortage of qualified workers by increasing pay and overall compensation, the Fed found that “wage increases remained modest” in most of the country. In addition, prices for goods and services were reported to have risen “moderately” in most regions of the country. All regions of the country were characterized as performing well. Manufacturers reported increasing production, while banks reported stronger demand for loans and home builders remained busy. Some businesses expressed worries about the Trump administration’s ongoing trade battles with China and other countries will disrupt international trade.
First quarter GDP grew at a bit slower pace than originally reported, primarily due to a slower buildup in inventories. Revised government figures showed that the U.S. economy grew at 2.2% in the first three months of 2018, down 0.1% from the initial report. Economists had predicted that GDP would remain unchanged. In the details, adjusted corporate profits before taxes fell 0.6% marking its second consecutive decline, while on the bright side corporations paid $117.4 billion less in taxes following President Trump’s tax cuts. As the government’s tax receipts declined, adjusted after-tax corporate profits surged 5.9%. Overall, nearly all signs continue to point to faster growth in the spring with economists now predicting that GDP is likely to top 3% for the third time in the past five quarters.
International Economic News: The Canadian economy slowed in the first quarter to its lowest pace in nearly two years, stifled by weakness in consumer spending and the housing market. Statistics Canada reported real gross domestic product rose at a seasonally-adjusted 1.3% annualized rate in the first three months of the year. It was the third consecutive quarter of sub-2% growth—a significant reduction from the nearly 4% average growth in the prior four quarters. A slowdown in Canada’s housing sector was evident as residential investment slumped an annualized 7.2% in the first quarter, a side-effect of recently-enacted stricter mortgage regulations. In addition, household final consumption spending grew just 1.1%, its slowest in three years. While the result disappointed economists, they noted that the quarter finished strong, with March GDP up 0.3% month over month, following February’s 0.4% rise. This implies the economy entered the second quarter with stronger momentum, prompting several economists to raise their second-quarter forecasts.
The British pound sterling languished near a six-month low despite recent data showing manufacturing activity in the United Kingdom accelerated in May for the first time in six months. Stronger-than-expected economic data this week has failed to support the pound, which last traded flat against the dollar at $1.3303. WorldFirst head of FX strategy Jeremy Cook noted, “The limelight is elsewhere right now and the UK economy is still quite hamstrung by slowing growth and Brexit concerns … there’s plenty of places people would rather be investing than in sterling right now.” Also weighing on the UK’s economy, research firm GfK released data showing consumer expectations in the UK remain below the 20-year average and consumers “remain resolutely downbeat about the general state of the economy.”
On Europe’s mainland, French Finance Minister Bruno Le Maire said that the United States poses a “danger to the global economy” as U.S. metal tariffs which took effect on June 1st will reduce growth and kill jobs. Trump originally imposed the steep metals tariffs in March, but had exempted key suppliers: the European Union, Canada and Mexico. Those exemptions were removed Friday. That sentiment was echoed by French President Emmanuel Macron who told US President Donald Trump that tariffs on steel and aluminum imports from the European Union are “illegal” and that the EU would respond in a “firm and proportionate manner”. “I think this decision is a mistake in many ways because it responds to existing international imbalances in the worst way — by breaking up and creating economic nationalism,” he said. “And nationalism is war. That’s exactly what happened in the 30s.” EU chief Jean-Claude Juncker says the bloc is poised to announce counter-measures immediately.
Germany, on the other hand, while also not happy about the new tariffs is reluctant to escalate a trade conflict with the United States lest a series of tit-for-tat trade tariffs jeopardize its lucrative exports of automobiles and other industrial goods. While German politicians had little to say this week, at a meeting last month with his counterparts from European nations, Peter Altmaier, German minister for economic affairs, urged that Europe avoid an escalating round of tariffs with the United States. The German minister suggested that Europe should accept quotas on its exports of steel as a cost of gaining a permanent exemption from the American metal tariffs. European Commission officials responded angrily to the German proposal, calling for stiff and unequivocal retaliation.
Italy is once again in the spotlight as a new government was sworn in this week, made up of members of the Italy’s far-left Five Star Movement and far-right League; neither are strong supporters of the Eurozone, but for vastly different reasons. Italian stocks plunged and bond yields soared this week when the country appeared to be headed for new elections that could have essentially been a proxy vote on Italy’s continued use of the euro. The parties have dropped some of their most explosive campaign pledges, such as calling for a referendum on whether Italy should abandon the euro or leave the European Union. Still, analysts say they’re planning tax cuts and a spending binge that could contain the seeds of a new European crisis.
In Asia, the International Monetary Fund (IMF) gave a vote of confidence to China’s economic forecasting that predicted the country’s growth will stay on track for the foreseeable future. The IMF supported authorities’ efforts at “rebalancing” China’s economy stating, “We welcome the authorities’ strategy to more decisively shift the policy focus from high-speed to high-quality growth.” The comments came after a two-week field visit with high-ranking financial leaders including Vice-Premier Liu He and central bank governor Yi Gang. However, not everyone was so confident. London-based Capital Economics published a research note forecasting China’s growth would slow to just 2% by the end of the decade, down from 6.9% last year. “China is facing its own headwinds and structural restraints, including a rapidly aging population and less friendly trading partners”, the report said.
Joining Europe, Japanese leaders are also condemning recently-enacted U.S. metal tariffs. Japanese Finance Minister Taro Aso called the new tariffs “deeply deplorable”; using unusually harsh language in a sign Japan was joining other G7 nations in attacking the Trump administration’s decision. Aso said while Japan remained undecided on whether to file a challenge to the new tariffs with the World Trade Organization, the country was making “various preparations”. “Inward-looking policies involving one-sided, protectionist measures benefit no country. It’s important to achieve high global growth through free and fair trade,” Aso said after attending the G7 finance leaders’ gathering. Fears of a global trade war have cast a pall over this week’s G7 talks where U.S. Treasury Secretary Steven Mnuchin was the prime target of criticism by other countries subject to the U.S. metals tariffs.
Finally: The latest government Non-Farms Payroll jobs report showed that the unemployment rate among African-Americans has dropped to a record low of just 5.9% in May. As the following graphic shows, the jobless rate for African-Americans has been steadily declining since 2011. Among African-American teenagers, the unemployment rate has fallen from a high of 48.9% in 2010 to just 19.8%. President Trump was widely mocked during the presidential campaign for encouraging blacks to vote for him because “what have you got to lose?” But no two ways about it, when it comes to jobs, things are turning out much better for African-Americans under Trump than most anyone would have guessed.

(sources: all index return data from Yahoo Finance; Reuters, Barron’s, Wall St Journal, Bloomberg.com, ft.com, guggenheimpartners.com, zerohedge.com, ritholtz.com, markit.com, financialpost.com, Eurostat, Statistics Canada, Yahoo! Finance, stocksandnews.com, marketwatch.com, wantchinatimes.com, BBC, 361capital.com, pensionpartners.com, cnbc.com, FactSet)
These are the opinions of WE Sherman and Co and not necessarily those of Cambridge, are for informational purposes only, and should not be construed or acted upon as individualized investment advice.
Indices mentioned are unmanaged and cannot be invested into directly. Past performance is no guarantee of future results. All Investing involves risk. Depending on the types of investments, there may be varying degrees of risk. Investors should be prepared to bear loss, including total loss of principal.