5-25-20 Weekly Market Update
The very Big Picture
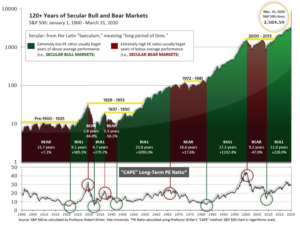
The long-term valuation of the market is commonly measured by the Cyclically Adjusted Price to Earnings ratio, or “CAPE”, which smooths-out shorter-term earnings swings in order to get a longer-term assessment of market valuation. A CAPE level of 30 is considered to be the upper end of the normal range, and the level at which further PE-ratio expansion comes to a halt (meaning that further increases in market prices only occur as a general response to earnings increases, instead of rising “just because”). The market was recently at that level.
Of course, a “mania” could come along and drive prices higher – much higher, even – and for some years to come. Manias occur when valuation no longer seems to matter, and caution is thrown completely to the wind – as buyers rush in to buy first, and ask questions later. Two manias in the last century – the “Roaring Twenties” of the 1920s, and the “Tech Bubble” of the late 1990s – show that the sky is the limit when common sense is overcome by a blind desire to buy. But, of course, the piper must be paid, and the following decade or two were spent in Secular Bear Markets, giving most or all of the mania-gains back.

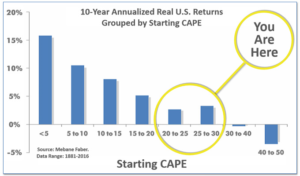
See Fig. 1 for the 100-year view of Secular Bulls and Bears. The CAPE is now at 27.78, up from the prior week’s 26.81 and now back below 30. Since 1881, the average annual return for all ten-year periods that began with a CAPE in the 20-30 range have been slightly-positive to slightly-negative (see Fig. 2).

Note: We do not use CAPE as an official input into our methods. However, if history is any guide – and history is typically ‘some’ kind of guide – it’s always good to simply know where we are on the historic continuum, where that may lead, and what sort of expectations one may wish to hold in order to craft an investment strategy that works in any market ‘season’ … whether current one, or one that may be ‘coming soon’!
The Big Picture:
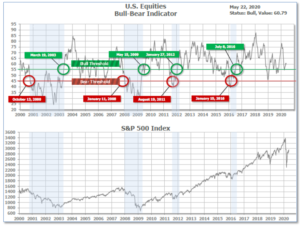
The ‘big picture’ is the (typically) years-long timeframe – the timeframe in which Cyclical Bulls and Bears operate. The U.S. Bull-Bear Indicator is in Cyclical Bull territory at 60.79 up from the prior week’s 59.72

In the Quarterly- and Shorter-term Pictures
The Quarterly-Trend Indicator based on the combination of U.S. and International Equities trend-statuses at the start of each quarter – was Negative entering April, indicating negative prospects for equities in the second quarter of 2020. (On the ‘daily’ version of the Quarterly-Trend Indicator, where the intra-quarter status of the Indicator is subject to occasional change, both the U.S. Equities and International Equities readings remain in ‘Down’ status; the daily International reading turned to Down on Thursday, Feb. 27th; the U.S. daily reading turned to Down on Friday, Feb. 28th.)
Next is the indicator for U.S. Equities, in the shortest time frame. The indicator turned positive on May 19th, and ended the week at 26, up from the prior week’s 15.

The Complete Picture:
Counting-up of the number of all our indicators that are ‘Up’ for U.S. Equities (see Fig. 3), the current tally is that three of four are Positive, representing a multitude of timeframes (two that can be solely days/weeks, or months+ at a time; another, a quarter at a time; and lastly, the {typically} years-long reading, that being the Cyclical Bull or Bear status).
In the Markets:
U.S. Markets: Stocks rose for the week with the benchmark S&P 500 index hitting its highest level since March 6 before falling back somewhat. Small and mid-cap stocks saw their strongest gains as they attempted to catch up to their larger cap brethren. The Dow Jones Industrial Average rose 3.3% to close at 24,465. The technology-heavy NASDAQ Composite, likewise, added 3.4%. The large cap S&P 500 added 3.2%, while the mid cap S&P 400 and small cap Russell 2000 were way out front, surging 7.4% and 7.8% respectively.
International Markets: Almost all major international markets finished in the green last week. Canada’s TSX rebounded 1.9%, while the United Kingdom’s FTSE bounced 3.3%. On Europe’s mainland, France’s CAC 40 rose 3.9%, Germany’s DAX surged 5.8%, and Italy’s Milan FTSE added 2.8%. In Asia, China’s Shanghai Composite declined -1.9%, while Japan’s Nikkei rose 1.8%. As grouped by Morgan Stanley Capital International, developed markets rose 3.2%, while emerging markets gained 1.1%.
Commodities: Gold ticked down in the face of last week’s impressive strength in the equities markets. The yellow metal declined -1.2%, or -$20.80, to $1735.50 an ounce. Silver rallied for a third consecutive week, rising 3.7% to $17.69 per ounce. Oil rose for a fourth consecutive week surging 12.6% to $33.25 per barrel for West Texas Intermediate crude. The industrial metal copper, viewed by some analysts as a barometer of world economic health due to its wide variety of uses, rebounded 2.4% last week.
U.S. Economic News: The number of Americans filing first time claims for unemployment insurance fell by 249,000 to 2.438 million last week. The number was in line with the consensus of 2.4 million new claims. New filings are well off their peak from late March, but remain in the millions as businesses continue to shed workers. Gradual reopening of state economies should bring about fewer initial jobless claims in the coming weeks and months. Continuing claims, which counts the number of Americans already receiving benefits, increased by 2.525 million to 25.073 million. That number is reported with a one-week delay.
Sales of previously-owned homes plunged -17.8% in April to a 4.33 million unit annual rate—the lowest level since July of 2010. The reading was the biggest drop in almost ten years, but better than economists’ forecasts of a -19.5% decline. Both single-family and multi-family sales fell significantly, with multi-family posting a record decline. Sales were down in all four regions of the country, led by the West. “Months of available supply” ticked up to 4.1 months from 3.4, but still remained below the 6 months generally considered to indicate a “balanced” housing market. Partly as a result of this, the median existing home price was up 7.4% from the same time last year.
Confidence among the nation’s homebuilders bounced back from its historic decline last month as the industry grew more optimistic about post-pandemic home sales. The National Association of Home Builders (NAHB) reported its monthly confidence index for May rose 7 points to 37. April’s reading had been the index’s lowest reading since June of 2012. In the details of the report, the index that measures current sales conditions increased 6 points to 42, while the index that gauges sales expectations in the next six months jumped 10 points to 46. By region, the West posted the largest increase, rising 12 points, followed by the Midwest and the South. Builder confidence in the Northeast, which includes the particularly hard-hit New York state, dropped two points. NAHB Chairman Dean Mon said in the report, “The fact that most states classified housing as an essential business during this crisis helped to keep many residential construction workers on the job, and this is reflected in our latest builder survey.”
The Commerce Department reported housing starts plunged 30% in April to a seasonally-adjusted annual rate of 891,000. It was the slowest pace of new home construction since February 2015. The reading missed economists’ forecasts for an annual rate of 900,000. Permit activity for newly-built homes fell 20.8% between March and April to a seasonally-adjusted annual rate of 1.07 million. That number, however, exceeded forecasts of a reading of 996,000.
Manufacturing activity in the Philadelphia area remains depressed but did show improvement, according to the latest data from the Philadelphia Federal Reserve. The Philly Fed’s General Business Activity Index rose 13.5 points to -43.1 this month—worse than the consensus of -40.0. Although off its record low the previous month, the index remains deep in contraction territory. Shipments, new orders, and employment continued to decline, albeit at somewhat slower rates. Furthermore, delivery times shortened and unfilled orders shrank which suggest weaker demand. On a positive note, manufacturers’ optimism about the next six months increased. The Future Activity index rose 6.7 points to 49.7, its highest level since December of 2017.
Federal Reserve Chairman Jerome Powell delivered a message to Congress this week with a simple theme: Do everything you can. All of us are affected, but the burdens are falling most heavily “on those least able to carry them,” Powell said. A recent Fed study indicated that almost 40% of the households making less than $40,000 a year lost a job during the first month of the pandemic. Powell has implied several times in recent remarks that Congress has to do more to support the economy. Washington has already passed almost $3 trillion in aid, but Democrats and Republicans are divided over the next step. Powell isn’t expected to back specific spending proposals and get drawn into the political fray, yet the chairman has become known for promoting policies that aim to help the most disadvantaged and distressed communities.
In the minutes from April’s Federal Open Market Committee meeting, Federal Reserve officials discussed how best to clarify its intentions regarding interest rates. The Fed said it expects to maintain the federal-funds rate at the present range of 0% to 0.25% “until it is confident the economy has weathered recent events and is on track to achieve its maximum employment and price stability goals.” Several officials said the Fed might need to provide clarity over the central bank’s ongoing unlimited purchase of Treasuries and mortgage-backed securities. The Fed has said these purchases were started and continue to facilitate the normal functioning of the financial markets. Without more communication, some officials said uncertainty might set in. Overall, Fed officials said they would use “the full range” of their tools to support the economy through the challenging pandemic.
International Economic News: Bank of Canada Governor Stephen Poloz offered a hopeful assessment of the Canadian economy’s ability to rebound from the pandemic, asserting his view that the risks to Canada’s economic outlook are frequently “overblown”. Speaking at his last press conference before stepping down next month, Poloz said the central bank needs to be prepared for a wide range of outcomes. Poloz has been more optimistic than many pundits on the outlook for recovery, believing the fiscal stimulus he has supported will allow Canadians to quickly pick up where they left off before the crisis struck. “We have to be able to manage the risks around those things, so I’m not going to dismiss” dire scenarios, Poloz said. “But, me personally, I do think on balance what I’m hearing, the flow that I’m hearing, is a little too dire, a little bit overblown.”
Across the Atlantic, economists in the United Kingdom are now predicting a much sharper fall in the UK’s gross domestic product this quarter then they did just a month ago. In a poll of economists by Reuters this week, the median forecast expected a -17.5% plunge this quarter. In a similar survey last month, economists had expected just a -13.1% decline. On the other hand, economists now see a sharper third-quarter recovery than they did last month. The median forecast is that UK GDP will surge 11.9% in the three months to September as at least some of the lockdown measures put in place to slow the spread of COVID-19 are lifted.
On Europe’s mainland, the leaders of Germany and France proposed a $543 billion Virus Recovery Fund to the help the European Union recover from the coronavirus pandemic. German Chancellor Angela Merkel and French President Emmanuel Macron proposed the plan that would involve the European Union borrowing money in financial markets to help sectors and regions that are particularly affected by the pandemic. The money would be disbursed in the form of grants rather than loans, with repayments made from the EU budget—an unprecedented proposal that overcomes long-standing objections in Berlin to the notion of collective borrowing. However, EU member states Austria, Sweden, Denmark and the Netherlands (dubbed the “frugal four”), stated their opposition to the plan this weekend.
For the first time in decades, China ditched its annual growth projection, thereby showing the true scale of the economic impact of the coronavirus on the world’s second largest economy. Every year China sets a formal target for GDP growth, usually around 6%. However, the uncertainty caused by the coronavirus led to Chinese leaders being unable to set a target for growth in 2020 because of the “great uncertainty” caused by COVID-19 and “the world economic and trade environment.” Last year, Beijing targeted growth in the range of 6.0% to 6.5%–GDP grew at 6.1%, its slowest rate of growth in nearly 30 years.
Japan’s economy has officially entered recession, defined as two consecutive quarters of negative economic growth, according to new economic data from Japan’s Cabinet Office. Real gross domestic product seasonally-adjusted contracted by -3.4% in the first quarter of 2020. On a positive note, the figure was lower than the median expectation of a -4.6% contraction. In the details of the report, the data showed that all major indicators of overall economic health had taken a hit, with production, exports, and consumer spending all down in the first quarter of the year. Given that Tokyo’s response to the pandemic intensified largely in the second quarter, analysts expect a worsening picture in the next quarter’s data.
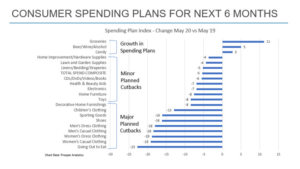
Finally: As the economy begins to reopen from the coronavirus lockdown economists have predicted just about every scenario possible, from a 1930’s-style long-running economic depression to an immediate recovery and a quick bounce back to new highs. Since the United States economy is predominantly consumer-driven, perhaps some insight can be gleaned from consumer spending plans covering the next 6 months. Uh-oh – only 3 categories of spending are seen as increasing: “Groceries”, “Beer/Wine/Alcohol” and “Candy”. Every single one of the other 18 categories show reduced spending plans. Not the sort of plans from which robust recoveries are made, unfortunately.

(Sources: All index- and returns-data from Yahoo Finance; news from Reuters, Barron’s, Wall St. Journal, Bloomberg.com, ft.com, guggenheimpartners.com, zerohedge.com, ritholtz.com, markit.com, financialpost.com, Eurostat, Statistics Canada, Yahoo! Finance, stocksandnews.com, marketwatch.com, wantchinatimes.com, BBC, 361capital.com, pensionpartners.com, cnbc.com, FactSet.) Securities offered through Registered Representatives of Cambridge Investment Research Inc., a broker-dealer, member FINRA/SIPC. Advisory Services offered through Cambridge Investment Research Advisors, a Registered Investment Adviser. Strategic Investment Partners and Cambridge are not affiliated.
Indices mentioned are unmanaged and cannot be invested into directly. Past performance is no guarantee of future results.
