
5-18-20 Weekly Market Update
The very Big Picture
The long-term valuation of the market is commonly measured by the Cyclically Adjusted Price to Earnings ratio, or “CAPE”, which smooths-out shorter-term earnings swings in order to get a longer-term assessment of market valuation. A CAPE level of 30 is considered to be the upper end of the normal range, and the level at which further PE-ratio expansion comes to a halt (meaning that further increases in market prices only occur as a general response to earnings increases, instead of rising “just because”). The market was recently at that level.
Of course, a “mania” could come along and drive prices higher – much higher, even – and for some years to come. Manias occur when valuation no longer seems to matter, and caution is thrown completely to the wind – as buyers rush in to buy first, and ask questions later. Two manias in the last century – the “Roaring Twenties” of the 1920s, and the “Tech Bubble” of the late 1990s – show that the sky is the limit when common sense is overcome by a blind desire to buy. But, of course, the piper must be paid, and the following decade or two were spent in Secular Bear Markets, giving most or all of the mania-gains back.
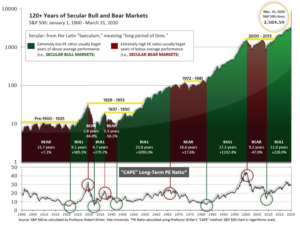
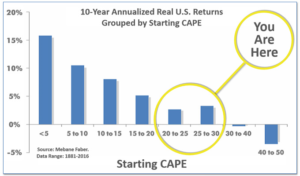
See Fig. 1 for the 100-year view of Secular Bulls and Bears. The CAPE is now at 26.81, down from the prior week’s 27.43 and now back below 30. Since 1881, the average annual return for all ten-year periods that began with a CAPE in the 20-30 range have been slightly-positive to slightly-negative (see Fig. 2).
Note: We do not use CAPE as an official input into our methods. However, if history is any guide – and history is typically ‘some’ kind of guide – it’s always good to simply know where we are on the historic continuum, where that may lead, and what sort of expectations one may wish to hold in order to craft an investment strategy that works in any market ‘season’ … whether current one, or one that may be ‘coming soon’!
The Big Picture:
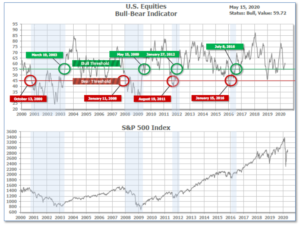
The ‘big picture’ is the (typically) years-long timeframe – the timeframe in which Cyclical Bulls and Bears operate. The U.S. Bull-Bear Indicator is in Cyclical Bull territory at 59.72 down from the prior week’s 60.69
In the Quarterly- and Shorter-term Pictures
The Quarterly-Trend Indicator based on the combination of U.S. and International Equities trend-statuses at the start of each quarter – was Negative entering April, indicating negative prospects for equities in the second quarter of 2020. (On the ‘daily’ version of the Quarterly-Trend Indicator, where the intra-quarter status of the Indicator is subject to occasional change, both the U.S. Equities and International Equities readings remain in ‘Down’ status; the daily International reading turned to Down on Thursday, Feb. 27th; the U.S. daily reading turned to Down on Friday, Feb. 28th.)
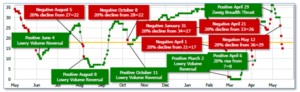
Next is the indicator for U.S. Equities, in the shortest time frame. The indicator turned negative on May 12th, and ended the week at 15, down from the prior week’s 30.
The complete Picture:
Counting-up of the number of all our indicators that are ‘Up’ for U.S. Equities, the current tally is that two of four are Positive, representing a multitude of timeframes (two that can be solely days/weeks, or months+ at a time; another, a quarter at a time; and lastly, the {typically} years-long reading, that being the Cyclical Bull or Bear status).
In the Markets:
U.S. Markets: The major U.S. indexes retreated as investors reacted to bleak economic data and multiple warnings of further weakness ahead. The declines were most pronounced in small-caps and slower-growing value stocks. Health care and consumer shares held up relatively well, while energy stocks lagged despite a rise in oil prices. The Dow Jones Industrial Average declined 646 points to finish the week at 23,685—a decline of -2.7%. The technology-heavy NASDAQ Composite retreated the least, at -1.2%. By market cap, the large cap S&P 500 gave up -2.3%, while the mid cap S&P 400 and small cap Russell 2000 fell a much larger -5.8% and -5.5%, respectively.
International Markets: Major international markets were a sea of red last week. Canada’s TSX declined -2.2%, while the United Kingdom’s FTSE retreated -2.3%. The situation was worse on Europe’s mainland with France’s CAC 40 falling ‑6.0% and Germany’s DAX giving up -4.0%. China’s Shanghai Composite fell -0.9%, while Japan’s Nikkei declined -0.7%. As grouped by Morgan Stanley Capital International, developed markets were off -3.0%, while emerging markets ended down -2.2%.
Commodities: Precious metals, usually thought to be “defensive”, obligingly rose in the face of weakness in the equities markets. Gold rose 2.5% to $1756.30 an ounce, while Silver surged a larger 8.2% to $17.07 an ounce. Oil rose for a third consecutive week. West Texas Intermediate crude oil finished the week up 12.8% to $29.52 per barrel. The industrial metal copper, viewed by some analysts as a barometer of world economic health due to its wide variety of uses, finished the week down -3.1%.
U.S. Economic News: The number of Americans seeking first-time unemployment benefits pulled back last week, but the reading still remained above 2 million amid coronavirus shutdowns. The Labor Department reported initial claims for unemployment insurance declined by 195,000 to 2.981 million, exceeding economists’ expectations of 2.7 million. While filings declined for a sixth straight week, they continued to run in the millions. Weekly readings of unemployment claims continue to be more than 10 times the number recorded at the start of the year. Continuing claims, which counts the number of Americans already receiving unemployment benefits, increased by 456,000 to an unprecedented 22.833 million. That number is reported with a one-week delay.
Sentiment among the nation’s small business owners continued to deteriorate significantly in the wake of the coronavirus and its associated economic lockdown. The National Federation of Independent Business (NFIB) reported its Small Business Optimism Index fell 5.5 points to 90.9 last month. However, the report wasn’t nearly as bad as economists’ expectations of a reading of just 84.8. In the details of the report, while sales expectations plunged 30 points to -42 – the lowest level in the NFIB’s 46-year history – small-business owners reported they nonetheless expect business conditions to improve in the near future. The index of expected business conditions six months from now climbed 24 points. “Owners’ optimism about future conditions indicates they expect the recession to be short-lived,” the NFIB said.
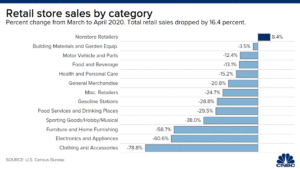
Sales at U.S. retailers collapsed a record -16.4% in April amid a severe recession and widespread stay-at-home orders. The consensus was for “just” a -12.3% decline. Nearly all categories dropped by double digits. Furniture, electronics, and apparel sales all fell by more than 50%. Food store sales, which had gone up the previous month, fell by -13.1% in April. The smallest declines were at building materials and garden supply stores as consumers took the extra time at home to work on homes and gardens. Online sales was the lone retail category that posted an increase–up 8.4%. On an annual basis, retail sales were down -7.6%–the steepest decline since September of 2009.
Prices at the consumer level posted their biggest decline since 2008. Consumer prices declined -0.8% last month, led by tumbling gasoline prices. The reading matched consensus forecasts. Stay-at-home orders in large parts of the country kept Americans off the roads and curbed the need to fuel up. Yet prices also fell by record amounts for a variety of other goods and services. Clothes, auto insurance, hotel rooms, and plane tickets also showed record price drops. However, the price of some high-demand goods did show increases. The cost of groceries jumped +2.6% as Americans dined at home. On an annual basis, the pace of inflation slowed to just 0.3% from 1.5% in March and 2.5% at the beginning of the year. Core inflation, which strips out the cost of food and energy, fell a record -0.4% last month. It was the first back-to-back decline in the core rate in 37 years.
At the wholesale level, prices had their largest decline on record as the coronavirus slowed the economy and crushed demand. The Bureau of Labor Statistics reported the wholesale cost of goods and services sank -1.3% in April. Economists had expected just a -0.5% drop. The decline last month was its third negative reading in a row and the largest since the government reconfigured its wholesale report in 2009 to include financial services and healthcare. On an annual basis, the rate of wholesale inflation turned negative for the first time since 2015, tumbling to -1.2% in April. Plunging oil prices drove much of the decline in wholesale costs in April. Gasoline prices sank almost -57%, the largest decline since the government began keeping track in 1947.
There was a tentative sign of a potential bottom in manufacturing in the New York area, according to the latest data from the New York Federal Reserve. The NY Fed’s Empire State General Business Conditions index rebounded 29.7 points in May to -48.5, as factory activity contracted for a third straight month–but at a less severe rate. Still, the reading is the second-lowest on record. Economists had expected a reading of -65. In the details, shipments, new orders, and employment all bounced off the previous month’s record lows. Of note, the Expectations Index jumped 22.1 points (the most since April 2009) to 29.1–a ten-month high. The reading indicates that manufacturers expect activity to sharply recover in the next six months.
International Economic News: According to a Bloomberg survey of economists, Canada’s economy will shrink by an annualized 42% in the second quarter. The estimate is absolutely staggering, as the expected decline is almost five times the size of the largest quarterly contraction during the 2008-2009 financial crisis. BMO Chief Economist Doug Porter stated, “We know March was terrible and April is going to be even worse, so the starting point is horrendous for the second quarter.” BMO has one of the more bearish forecasts with second quarter GDP down -44%. However on a brighter note, the bank expects a substantial rebound in the third quarter. Canada’s economy has taken a double hit from the COVID-19 pandemic and plunging oil prices.
Across the Atlantic, the United Kingdom’s economy shrank by a record 5.8% in March, according to official data. The reading virtually guarantees the United Kingdom has entered a recession. Chancellor Rishi Sunak stated, “Technically a recession is defined as two quarters of negative GDP, we’ve now had one…so yes, it is now very likely that the UK is facing a significant recession at the moment and this year.” The Office for National Statistics said: “The impacts of the coronavirus were seen right across the economy, with nearly all sub-sectors falling in the three months to March.”
On Europe’s mainland, with social distancing measures potentially lasting until 2022, and international travel at a standstill, those in the tourism industry – particular in Paris – stand to be especially hard-hit. French Prime Minister Eduoard Philipe announced an 18 billion euro ($19.4 billion USD) stimulus package for hotels, restaurants, and other businesses in the tourism industry. “What is good for tourism is often good for France, what strikes tourism strikes France,” he said. Dubbed a “Marshall Plan” for the tourism industry, the package includes a solidarity fund through the end of 2020; more funds for larger government-backed loans to businesses; and an extension of government-paid partial unemployment for workers as long as companies are forced to remain closed.
Germany has entered a recession as its economy shrank -2.2% in the first three months of the year, official figures indicate. The data from the Federal Statistics Office come as Germany takes its first tentative steps to exit lockdown. In the same release, figures for the final quarter of 2019 were revised down to show a contraction of -0.1%. That means German GDP growth has been negative for two consecutive quarters, the technical definition of a recession. Germany is Europe’s largest economy, but the drop is not as bad as in some of its neighbors, such as France, which has seen a decline of -5.8%, and Italy, which reported a -4.7% fall.
Production at China’s factories is growing for the first time since the coronavirus pandemic began. Industrial output increased 3.9% in April from the same time last year, according to data from China’s National Bureau of Statistics. The reading was well above the 1.5% increase analysts had expected, and the first time output has grown since December. Julian Evans-Pritchard, senior China economist at Capital Economics wrote, “The growth detailed on Friday can be attributed to the political pressure that Beijing is putting on factories to resume production.” He expects factory output to continue to grow, since policymakers have signaled that more stimulus measures are on the way.
A key Japanese economic indicator fell at its fastest pace in nine years, signaling a high probability of a deep recession. Japan’s index of coincident economic indicators, which consists of a range of data including factory output, employment, and retail sales, dropped a preliminary -4.9 points to 90.5 in March the Cabinet Office said. It was the fastest pace of decline since March 2011 when a devastating earthquake, tsunami and nuclear disaster hit Japan. Japanese Economy Minister Yasutoshi Nishimura said that the data will likely deteriorate further in April as a state of emergency was declared last month to halt the spread of coronavirus infections. “The coincident indicator index is expected to continue showing a severe condition,” he said.
Finally: April retail sales showed a decline in every category, topping out at a -78.8% decline in the “Clothing and Accessories” category. Every category but one, that is. The lone retail category to gain ground in April was “Nonstore Retailers”, kind of a roundabout way of saying “online sellers”. Led by Amazon, online retailers have seen a big jump in sales. In the first quarter, Amazon reported sales jumped 26% year-over-year as consumers flocked to its site. The sales volume was so high that the company temporarily halted delivery for non-essential items and has hired an additional 175,000 workers, with still more being sought. And Amazon founder and CEO Jeff Bezos could become earth’s first trillionaire: the firm Comparisun predicts that Bezos could reach such an astounding level of wealth by 2026, if his wealth continues to increase at the pace of the past 5 years. (chart from cnbc.com)
(Sources: All index- and returns-data from Yahoo Finance; news from Reuters, Barron’s, Wall St. Journal, Bloomberg.com, ft.com, guggenheimpartners.com, zerohedge.com, ritholtz.com, markit.com, financialpost.com, Eurostat, Statistics Canada, Yahoo! Finance, stocksandnews.com, marketwatch.com, wantchinatimes.com, BBC, 361capital.com, pensionpartners.com, cnbc.com, FactSet.) Securities offered through Registered Representatives of Cambridge Investment Research Inc., a broker-dealer, member FINRA/SIPC. Advisory Services offered through Cambridge Investment Research Advisors, a Registered Investment Adviser. Strategic Investment Partners and Cambridge are not affiliated.
Indices mentioned are unmanaged and cannot be invested into directly. Past performance is no guarantee of future results.