
5-23-21 Weekly Market Update
The very Big Picture
The long-term valuation of the market is commonly measured by the Cyclically Adjusted Price to Earnings ratio, or “CAPE”, which smooths-out shorter-term earnings swings in order to get a longer-term assessment of market valuation. A CAPE level of 30 is considered to be the upper end of the normal range, and the level at which further PE-ratio expansion comes to a halt (meaning that further increases in market prices only occur as a general response to earnings increases, instead of rising “just because”). The market was recently at that level.
Of course, a “mania” could come along and drive prices higher – much higher, even – and for some years to come. Manias occur when valuation no longer seems to matter, and caution is thrown completely to the wind – as buyers rush in to buy first, and ask questions later. Two manias in the last century – the “Roaring Twenties” of the 1920s, and the “Tech Bubble” of the late 1990s – show that the sky is the limit when common sense is overcome by a blind desire to buy. But, of course, the piper must be paid, and the following decade or two were spent in Secular Bear Markets, giving most or all of the mania-gains back.
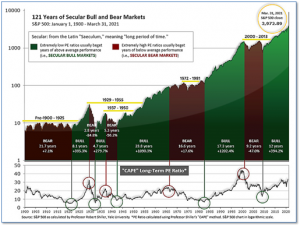
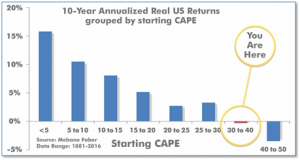
See Fig. 1 for the 100-year view of Secular Bulls and Bears. The CAPE is now at 36.86, down from the prior week’s 37.32. Since 1881, the average annual return for all ten-year periods that began with a CAPE in the 30-40 range has been slightly negative (see Fig. 2).
Note: We do not use CAPE as an official input into our methods. However, if history is any guide – and history is typically ‘some’ kind of guide – it’s always good to simply know where we are on the historic continuum, where that may lead, and what sort of expectations one may wish to hold in order to craft an investment strategy that works in any market ‘season’ … whether current one, or one that may be ‘coming soon’!
The big Picture:
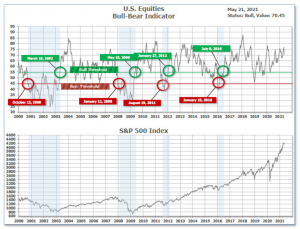
The ‘big picture’ is the (typically) years-long timeframe – the timeframe in which Cyclical Bulls and Bears operate. The U.S. Bull-Bear Indicator is in Cyclical Bull territory at 70.45 down from the prior week’s 73.71.
In the Quarterly- and Shorter-term Pictures
The Quarterly-Trend Indicator based on the combination of U.S. and International Equities trend-statuses at the start of each quarter – was Positive on March 31, indicating positive prospects for equities in the first quarter of 2021.
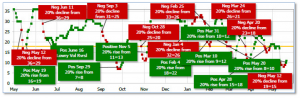
Next, the short-term(weeks to months) Indicator for US Equities turned Positive on May 20 and ended the week at 11, up from the prior week’s 9.
In the Markets:
U.S. Markets: U.S. indices posted mixed results in a volatile week of trading. The large-cap S&P 500 index ended the week modestly lower while the technology-heavy NASDAQ Composite gained a little ground. The Dow Jones Industrial Average had its second consecutive negative week, declining -0.5% to 34,208. The Nasdaq Composite ended a four week losing streak by finishing the week up 0.3%. By market cap, the large cap S&P 500 retreated -0.4%, while the mid-cap S&P 400 and Russell 2000 fell -1.2% and -0.4%, respectively.
International Markets: International markets finished the week predominantly to the upside, but with no large moves anywhere. Canada’s TSX retraced all last week’s decline and then some, rising 0.8%. The United Kingdom’s FTSE 100 closed down for a second week retreating -0.4%. On Europe’s mainland, France’s CAC 40 finished essentially flat, while Germany’s DAX ticked up 0.1%. In Asia, China’s Shanghai Composite ticked down -0.1%, while Japan’s Nikkei rose 0.8%. As grouped by Morgan Stanley Capital International, developed markets ended the week up 0.6% and emerging markets added 0.4%.
Commodities: Gold had a third consecutive week of gains, rising 2.1% to $1876.70 per ounce. Silver rose a lesser 0.4% to $27.49 per ounce. Following three weeks of gains, traders took profits in oil. West Texas Intermediate crude oil finished the week down -2.7% to $63.58 per barrel. The industrial metal copper, viewed by some analysts as a barometer of world economic health due to its wide variety of uses, finished the week down -3.7%, its second week of declines.
U.S. Economic News: The number of Americans filing first time unemployment benefits hit a new pandemic low coming in better than analyst estimates. The Labor Department reported initial jobless claims totaled 444,000 last week whereas economists had expected claims to total 452,000. This time last year, claims had totaled more than 2.3 million. While Federal Reserve officials stress the need for more improvement in the jobs picture, the claims numbers suggest that employment is growing consistently. However, continuing claims, which counts the number of people already receiving benefits, edged higher by rising to 3.75 million. That number is reported with a one-week delay.
The nation’s homebuilders remain confident, but rising costs of materials are posing major risks the National Association of Home Builders (NAHB) reported. The NAHB said builder sentiment in the single-family housing market remained unchanged at 83 this month. Readings above 50 are considered positive sentiment. The index had plummeted to 37 last May, as the pandemic lockdown hit and the housing market shut down. It then rebounded dramatically in June and July, as consumers rushed to the suburbs seeking more space for working and schooling from home. Builders report strong buyer traffic with continued low mortgage rates helping with affordability, however with prices rising fast they note purchasing power is weakening. “First-time and first-generation homebuyers are particularly at risk for losing a purchase due to cost hikes associated with increasingly scarce material availability,” said Chuck Fowler, National Association of Home Builders chairman. Aggregate residential material costs are now up 12% year over year, according to the NAHB, with some materials – most notably lumber – up much more.
Housing starts tumbled more than expected in April, likely pulled down by soaring prices for materials analysts say. The Commerce Department reported housing starts fell 9.5% to a seasonally-adjusted annual rate of 1.569 million units in April. Economists had expected starts would fall to 1.710 million units. Year-over-year starts were up 67.3% in April. Groundbreaking activity dropped in the Midwest and south, but rose in the Northeast and West. Permits for future homebuilding rose 0.3% to a rate of 1.760 million units in April. They soared 60.9% compared to April 2020.
Manufacturing activity in the New York-region remained strong this month, holding near its highest level in over three years. The New York Fed reported its Empire State Manufacturing index down-ticked to a reading of 24.3 in May from 26.3 in April. Economists had expected a reading of 24.8. In the report, the new orders index rose 2 points to 28.9, while shipments rose 4.7 points to 29.7. Both price indices hit record highs. The prices paid index rose 8.8 points to 83.5 while prices received rose 2.2 points to 37.1. On a negative note, expectations for business in the next six months slipped 3.2 points to 36.6. The Empire State reports gets particular attention as it is seen as a leading indicator of national trends.
A measure of output at U.S. manufacturers and service providers advanced to a new record this month, underscoring the solid demand that is contributing to inflationary pressures. Data firm IHS Markit said its flash U.S. manufacturing Purchasing Managers Index (PMI) increased 1 point to 61.5 in the first half of this month. That was the highest reading since the survey was expanded to cover all manufacturing industries in October 2009. Economists had forecast the index dipping to 60.2 in early May. A reading above 50 indicates growth in manufacturing, which accounts for 11.9% of the U.S. economy. Booming demand also boosted the services sector, which bore the brunt of the pandemic. The IHS Markit’s flash services sector PMI surged 5.4 points to 70.1—also its highest reading since the series started in October 2009. The services sector accounts for more than two-thirds of U.S. economic activity.
The Conference Board reported its Leading Economic Index (LEI) had its second consecutive solid gain in April, further evidence that the economic recovery is gathering momentum. The LEI rose 1.6% in April after a 1.3% gain in March. It was the strongest gain since last July. “The U.S. LEI suggests the economy’s upward trend should continue and growth may even accelerate in the near term,” said Ataman Ozyildirim, senior director of economic research at the Conference Board. The index has recovered fully from its COVID-19 contraction. The Conference Board now forecasts real GDP could grow around in a range of 8%-9% in the second quarter, with annual growth expected to reach 6.4%.
According to minutes from the latest Federal Open Market Committee meeting, Federal Reserve officials remained cautiously optimistic about the U.S. economic recovery. Notes showed some officials signaled they were open to discussing scaling back the central bank’s massive bond purchases “at some point”. Minutes stated, “A number of participants suggested that if the economy continued to make rapid progress toward the Committee’s goals, it might be appropriate at some point in upcoming meetings to begin discussing a plan for adjusting the pace of asset purchases.” Officials held interest rates near zero at the meeting and pledged to continue buying $80 billion in Treasuries and $40 billion in mortgage-backed securities every month until “substantial further progress” had been made on their employment and inflation goals.
International Economic News: The Bank of Canada said high household indebtedness and imbalances in the housing market have intensified in the last year, leaving Canada’s economy more vulnerable to economic shocks. Canada’s housing market boom and the corresponding rise in mortgage debt prop up economic growth in the short-term but also increase the risk to the economy and financial system over the medium-term, the central bank said in its annual review of financial systems. Although consumer debt has fallen since early 2020, an increase in mortgage debt has more than offset that decline, with total household debt rising sharply since mid-2020. The share of newly issued mortgages with a loan-to-income ratio above 450% rose substantially in the second half of 2020, and now account for 22% of all new mortgages. That is above the range seen in 2016-17, before Canada’s financial regulator introduced mortgage stress tests intended to cut out risky lending.
The UK economic recovery will be “fast and full”, economic data suggested. Businesses reported the strongest pace of growth in activity in more than 20 years and official figures showed shoppers heading to newly reopened stores in “hordes”. The flash, or interim, composite purchasing managers’ index (PMI), published by research group IHS Markit and the Chartered Institute of Procurement and Supply, rose 1.3 points to 62 in May, marking the highest PMI reading since records began in January 1998. Chris Williamson, chief business economist at IHS Markit said, “The UK is enjoying an unprecedented growth spurt as the economy reopens.”
On Europe’s mainland, French Finance Minister Bruno Le Maire warned that peace, security and global stability are in danger if the world’s economic superpowers do not contribute to Africa’s economic recovery from the Covid-19 crisis. African leaders met in Paris over the past two days in a summit convened by France to strike a multibillion-dollar “New Deal” to aid the economic and health revival of the continent. The Summit on the Financing of African Economies brought together 21 heads of state from Africa and leaders of continental organizations along with European leaders and the heads of major international finance organizations. In a press conference, French President Emmanuel Macron said the summit had yielded “a New Deal for Africa and by Africa.”
Germany’s DIHK Chambers of Industry and Commerce raised its growth forecast for Europe’s largest economy to 3% this year after its recent survey pointed to improved business morale over the past three months. The DIHK’s updated growth forecast compares with its previous estimate of 2.8% projected in February and is based on the latest findings of the association’s survey among more than 27,000 companies from various sectors of the economy. The DIHK forecast is less optimistic than the government’s projection of 3.5% GDP growth this year. The German economy shrank by 4.8% last year due to the pandemic. “There is cautious optimism among export-oriented industrial companies due to economic catch-up effects, but there is still a considerable amount of skepticism, particularly among the sectors affected by the lockdown, due to ongoing coronavirus restrictions,” DIHK said in a summary of its survey.
In Asia, China’s National Bureau of Statistics reported retail sales were up 17.7% in April from the same time a year ago, although the reading missed analyst expectations. Analysts had expected growth of 24.9%. April’s retail sales figure also marked a slowdown from 34.2% year-on-year growth in March. “China is still seeing an unbalanced recovery, as employment, household income, consumption, manufacturing investment, (the) service sector and private firms have yet to come back to (the) pre-Pandemic level,” Bruce Pang, head of macro and strategy research at China Renaissance, said in a statement. In a quarterly monetary policy report released last week, the People’s Bank of China noted that the foundation for economic recovery is not yet solid and consumer spending remains constrained.
Japan’s economy shrank more than expected in the first quarter as a slow vaccine rollout and new COVID-19 infections hit consumer spending, raising concerns the country will lag behind others emerging from the pandemic. Furthermore, capital expenditure also fell unexpectedly and export growth slowed sharply. The dismal reading and extended state of emergency curbs have heightened the risk Japan may shrink again in the current quarter and slide back to recession, some analysts say. Yoshimasa Maruyama, chief market economist at SMBC Nikko Securities stated, “Consumption will probably remain stagnant, raising risks of an economic contraction in the current quarter.” The economy shrank an annualized 5.1% in the first quarter, more than the median market forecast for a 4.6% contraction.
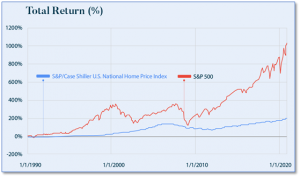
Finally: Single-family homes had their biggest price increase on record in the first quarter of this year. With many analysts noting the real estate market is “white hot”, it might be helpful to look at a relative comparison of real estate to the other main source of U.S. homeowner wealth – the stock market. The following graph from analytics firm Visual Capitalist shows the total return since 1990 of the U.S. National Home Price Index compared to the benchmark S&P 500 stock market index. The Home Price Index has gone up a respectable 200% since 1990, but looks quite tame compared to the 1000% return from the S&P 500 over the same period.
(Sources: All index- and returns-data from Yahoo Finance; news from Reuters, Barron’s, Wall St. Journal, Bloomberg.com, ft.com, guggenheimpartners.com, zerohedge.com, ritholtz.com, markit.com, financialpost.com, Eurostat, Statistics Canada, Yahoo! Finance, stocksandnews.com, marketwatch.com, wantchinatimes.com, BBC, 361capital.com, pensionpartners.com, cnbc.com, FactSet.) Securities offered through Registered Representatives of Cambridge Investment Research Inc., a broker-dealer, member FINRA/SIPC. Advisory Services offered through Cambridge Investment Research Advisors, a Registered Investment Adviser. Strategic Investment Partners and Cambridge are not affiliated. Indices mentioned are unmanaged and cannot be invested into directly. Past performance is no guarantee of future results.