
5-23-2022 Weekly Market Update
The very Big Picture
The long-term valuation of the market is commonly measured by the Cyclically Adjusted Price to Earnings ratio, or “CAPE”, which smooths-out shorter-term earnings swings in order to get a longer-term assessment of market valuation. A CAPE level of 30 is considered to be the upper end of the normal range, and the level at which further PE-ratio expansion comes to a halt (meaning that further increases in market prices only occur as a general response to earnings increases, instead of rising “just because”). The market is now above that level.
Of course, a “mania” could come along and drive prices higher – much higher, even – and for some years to come. Manias occur when valuation no longer seems to matter, and caution is thrown completely to the wind – as buyers rush in to buy first, and ask questions later. Two manias in the last century – the “Roaring Twenties” of the 1920s, and the “Tech Bubble” of the late 1990s – show that the sky is the limit when common sense is overcome by a blind desire to buy. But, of course, the piper must be paid, and the following decade or two were spent in Secular Bear Markets, giving most or all of the mania-gains back.
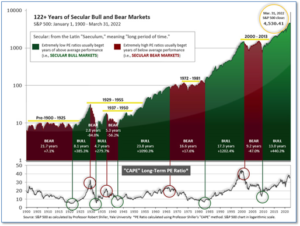
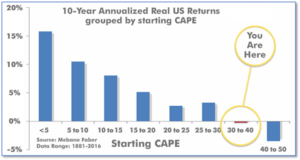
See Fig. 1 for the 100-year view of Secular Bulls and Bears. The CAPE is now at 30.71, down from the prior week’s 31.68. Since 1881, the average annual return for all ten-year periods that began with a CAPE in this range has been negative (see Fig. 2).
Note: We do not use CAPE as an official input into our methods. However, if history is any guide – and history is typically ‘some’ kind of guide – it’s always good to simply know where we are on the historic continuum, where that may lead, and what sort of expectations one may wish to hold in order to craft an investment strategy that works in any market ‘season’ … whether the current one, or one that may be ‘coming soon’!
The Big Picture:
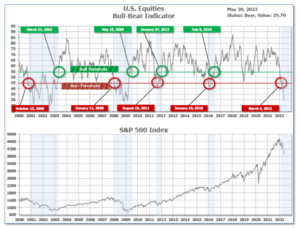
The ‘big picture’ is the (typically) years-long timeframe – the timeframe in which Cyclical Bulls and Bears operate. The U.S. Bull-Bear Indicator finished the week in Bear territory at 29.70, down from the prior week’s 32.41.
In the Quarterly- and Shorter-term Pictures
The Quarterly-Trend Indicator based on the combination of U.S. and International Equities trend-statuses at the start of each quarter – was Negative entering April, indicating negative prospects for equities in the second quarter of 2022.
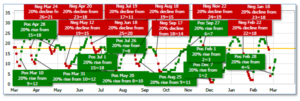
Next, the short-term(weeks to months) Indicator for US Equities turned positive on May 13, and ended the week at 9, up from the prior week’s 1.
In the Markets:
U.S. Markets: Wall Street continued its losing streak as fears grew that inflation was causing consumers to pull back on spending, setting the stage for an imminent recession. At its lows on Friday, the S&P 500 was down roughly 20.9% from its January intraday high, exceeding the 20% threshold signifying a “bear market”. The index’s biggest declines came on Wednesday, when it suffered its biggest daily loss since June 2020. The Dow Jones Industrial Average shed almost 1000 points last week, declining -2.9% to 31,262. The technology-heavy Nasdaq Composite declined for a seventh consecutive week giving up -3.8% finishing at 11,355. By market cap, the large cap S&P 500 ended down -3.0%, while the mid cap S&P 400 index fell -1.9% and the small cap Russell 2000 finished the week down -1.1%.
International Markets: Major international markets finished the week mixed, with Europe lower and Asia higher. Canada’s TSX rebounded 0.5%, while the United Kingdom’s FTSE 100 reversed last week’s gain and fell -0.4%. On Europe’s mainland, France’s CAC 40 and Germany’s DAX fell -1.2% and -0.3%, respectively. Major markets in Asia finished the week in the green. China’s Shanghai Composite finished up 2%, while Japan’s Nikkei added 1.2%. As grouped by Morgan Stanley Capital International, developed markets rose 1.2%. Emerging markets gained 1.6%.
Commodities: Precious metals finished the week in the green given the continued weakness in the equity markets and rising inflation. Gold rose 1.9% to $1842.10 per ounce, while Silver gained 3.2% to $21.67. Oil finished the week mixed with Brent crude oil rising 1.3% to $112.90 per barrel, while West Texas Intermediate ticked down -0.2% to $110.28. The industrial metal copper, viewed by some analysts as a barometer of world economic health due to its wide variety of uses, finished the week up 2.4%.
U.S. Economic News: The number of Americans filing for first-time unemployment benefits climbed to a four-month high last week, the Labor Department reported. Applications for unemployment benefits climbed to 218,000, exceeding the consensus forecast of a reading of 200,000. Still, readings in the low 200’s indicate a strong labor market. Job openings remain near record highs, and businesses continue to complain that they can’t find enough qualified workers. Meanwhile, the number of people already collecting benefits fell by 25,000 to 1.32 million. That reading is at its lowest level since 1969.
Sales of existing homes fell for a third consecutive month in April, according to the National Association of Realtors (NAR). The NAR reported existing-home sales fell -2.4% to a seasonally adjusted annual rate of 5.61 million. Compared with the same time last year, sales were down -5.9%. A shortage of affordable homes for sale continued to be a major factor. The total inventory of homes for sale was 1.03 million units, down 10.4% from one year ago. In terms of the months-supply metric, there was a 2.2-month supply of homes for sale in April—six months is generally considered a ‘balanced’ housing market. Also of note, the median price for an existing home is at an all-time high of $391,200—up 14.8% from April 2021. Lawrence Yun, the National Association of Realtors’ chief economist didn’t pull any punches in an interview with reporters stating bluntly, “I expect further declines in home sales.”
Construction of new houses fell slightly last month, the second consecutive decline. The data suggests that rising mortgage rates, record home prices, the high cost (and now scarcity) of building materials and qualified workers are all now starting to have an impact. The Census Bureau reported housing starts dipped 0.2% to an annual pace of 1.72 million. Economists had expected starts to register a 1.75 million annual rate. Single family houses accounted for about 64% of new construction in April, well below its historical average. Work on multi-family projects such as apartments and condominiums, jumped almost 17% to a 612,000 annual rate—the highest since 1986. Builders are putting more focus on larger projects with multiple units to rent to satisfy demand. Builders are anticipating most people will be unable to afford a new home and will be forced to rent instead. Also in the report, the number of permits slipped 3.2% to a 1.82 million annual rate. Analysts look at permits data for an “early read” on future housing reports. Chief economist Stephen Stanley of Amherst Pierpont Securities stated, “It will be important to watch housing data, as this sector could be the canary in the coalmine that offers an early read on how sensitive the economy will be to higher interest rates.”
Manufacturing activity in New York plunged this month, missing expectations by a wide margin. The New York Federal Reserve reported its Empire State Business Conditions Index plummeted 36.2 points to -11.6 in May—economists had expected a slight pullback to 16.5. The details of the report were as bad as the headline reading as both new orders and shipments declined sharply. The new orders index plunged 33.9 points to -8.8, while shipments collapsed -49.9 to -15.4. Of little solace, there were declines in both input and selling prices but not enough to signal a cooling in inflationary pressures. Economists use the data as an early read on the health of the manufacturing sector. On its release, Ian Shepherdson chief economist at Pantheon Macroeconomics stated “Soft, but not a definitive guide to national manufacturing.”
It was a similar story in the city of Brotherly Love. The Philadelphia Federal Reserve reported its gauge of regional manufacturing activity also fell sharply in May—from 17.6 to just 2.6. That was the lowest reading since the recession in early 2020. Economists had expected a reading of 15. The headline index is based on a single stand-alone question about business conditions unlike the national ISM manufacturing index which is a composite based on components. Firms continued to report increases in prices for inputs and their own products. Firms expect rising prices over the next year, with the median forecast for the rate of consumer inflation at 6.5%, up from 5% when the question was last asked in February. The measure on six-month business outlook slumped 5.7 points to 2.5 in May.
Sales among the nation’s retailers rebounded last month—a lonely sign of strength in an otherwise troubled economy. The Census Bureau reported retail sales rose a solid 0.9% in April, with auto dealers leading the way. Economists had expected a 1% advance. After adjusting for a 0.3% increase in inflation in April, retail sales rose roughly 0.6%. Auto sales jumped 2.2% last month, reversing a sharp drop in March. On the opposite end of the spectrum, sales at gas stations slid 2.7% in April after a brief respite in gas prices. Consumer spending is a huge part of the U.S. economy, accounting for about 70% of overall economic activity. Paul Ashworth, chief economist at Capital Economics stated, “Given this show of strength from consumers, speculation that the U.S. economy is in danger of an imminent plunge into recession looks misplaced.”
International Economic News: Home sales in Canada fell 12.6% in April from March, with even steeper pullbacks seen in the formerly red-hot markets of Toronto and Vancouver. Economists noted the housing downturn taking hold in Canada will act as a headwind to economic growth for the remainder of the year. Furthermore, given that more rate hikes are on the way, many economists say Canada could be in the early stages of a protracted housing slump. David Doyle, head of economics at Macquarie Group, noted the drop in home sales and rise in interest rates creates “significant downside risks for Canada’s economy.” Already the largest industry in Canada, real estate became an even bigger chunk of the economy during the pandemic, largely due to record-low mortgage rates that encouraged frenzied buying.
Across the Atlantic, the confidence of consumers in the United Kingdom fell to its lowest level since records began in 1974 amid growing concerns over the cost of living. The headline UK consumer confidence index, a measure of how people view their personal finances and the wider economic outlook, dropped by two percentage points to -40 in May. The reading surpassed the previous record low of -39 set in July 2008 when the global banking system was imploding. Almost all confidence measures tracked by the polling firm GfK fell in May. Joe Staton, client strategy director at GfK, said: “This means consumer confidence is now weaker than in the darkest days of the global banking crisis, the impact of Brexit on the economy, and the Covid shutdown.”
On Europe’s mainland, French President Emmanuel Macron re-appointed Bruno Le Maire as his finance minister. Le Maire thanked Macron stating his priorities, “employment, industrial sovereignty, and fighting inflation.” Le Maire hailed from the center right opposition when he joined Macron’s government in 2017 and proved to be one of Macron’s closest allies. Le Maire has served for five years without interruption—a post-World War 2 record for French finance ministers. Le Maire’s first challenge will be to convince French people heading to the polls in June’s legislative elections that Macron’s new government can address a cost-of-living crisis as inflation continues to surge.
The German government told German companies they could open ruble accounts to continue buying Russian gas following approval from Brussels. The debate over Russia’s demand that foreign buyers pay for gas in rubles has tested the resolve of European governments to take a hard line against Moscow over the war in Ukraine. Poland, Bulgaria, and Finland have refused to comply with Moscow’s demand that importers pay for gas via ruble accounts with Gazprombank and have seen their supplies cut.
In Asia, for the first time since 1976 the U.S. economy is expected to outpace China’s as its economy struggles with draconian coronavirus lockdowns. China’s Gross Domestic Product will grow by just 2% this year, according to a Bloomberg Economics estimate, trailing the predicted 2.8% growth in the U.S. If the prediction is correct, it would mark the first time in 46 years that China, the world’s second-largest economy, has lagged the U.S.’s full-year growth pace, according to World Bank Data. Chinese President Xi Jinping has set an official growth target of 5.5% this year and officials are said to have been warned that they must ensure China’s growth outpaces the U.S., according to the Wall Street Journal.
The International Monetary Fund projects the Japanese economy will continue to recover this year but warns of downside risks including price hikes. IMF economist Ranil Salgado stated consumption would rebound as coronavirus restrictions are lifted, helping the economy to recover, but downside risks such as supply-chain disruptions and geopolitical tensions remain. Salgado forecasts economic growth for Japan of 2.4% this year. Salgado said the Japanese government is taking appropriate measures to bolster the economy, but it will be important to continue efforts for “fiscal reconstruction” after the economy recovers.
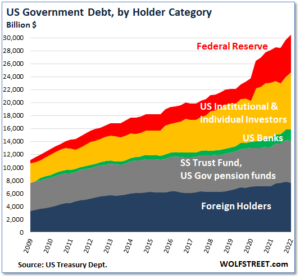
Finally: The U.S. gross national debt has now reached $30.4 trillion, following a massive $7.0 trillion spike since the coronavirus pandemic took hold in March 2020. Every one of these debt securities had to be purchased and held by an entity such as a bank, a pension fund, a foreign government, or even an individual investor. So, who exactly is holding $30.4 trillion of Treasury securities? Wolf Richter at Wolfstreet.com parsed the data and created a beautiful graph to explain. In short, while foreign holdings of U.S. Treasuries have declined from 34% in 2016 to just 25% now, both the Federal Reserve and U.S. institutional and individual investors have picked up the slack and expanded their buying. The Federal Reserve now holds 19% of all government debt. (Chart from wolfstreet.com)
(Sources: All index- and returns-data from Yahoo Finance; news from Reuters, Barron’s, Wall St. Journal, Bloomberg.com, ft.com, guggenheimpartners.com, zerohedge.com, ritholtz.com, markit.com, financialpost.com, Eurostat,0020Statistics Canada, Yahoo! Finance, stocksandnews.com, marketwatch.com, wantchinatimes.com, BBC, 361capital.com, pensionpartners.com, cnbc.com, FactSet.) Content provided by WE Sherman and Company. Securities offered through Registered Representatives of Cambridge Investment Research Inc., a broker-dealer, member FINRA/SIPC. Advisory Services offered through Cambridge Investment Research Advisors, a Registered Investment Adviser. Strategic Investment Partners and Cambridge are not affiliated. Indices mentioned are unmanaged and cannot be invested into directly. Past performance is no guarantee of future results.