
5-16-2022 Weekly Market Update
The very Big Picture
The long-term valuation of the market is commonly measured by the Cyclically Adjusted Price to Earnings ratio, or “CAPE”, which smooths-out shorter-term earnings swings in order to get a longer-term assessment of market valuation. A CAPE level of 30 is considered to be the upper end of the normal range, and the level at which further PE-ratio expansion comes to a halt (meaning that further increases in market prices only occur as a general response to earnings increases, instead of rising “just because”). The market is now above that level.
Of course, a “mania” could come along and drive prices higher – much higher, even – and for some years to come. Manias occur when valuation no longer seems to matter, and caution is thrown completely to the wind – as buyers rush in to buy first, and ask questions later. Two manias in the last century – the “Roaring Twenties” of the 1920s, and the “Tech Bubble” of the late 1990s – show that the sky is the limit when common sense is overcome by a blind desire to buy. But, of course, the piper must be paid, and the following decade or two were spent in Secular Bear Markets, giving most or all of the mania-gains back.
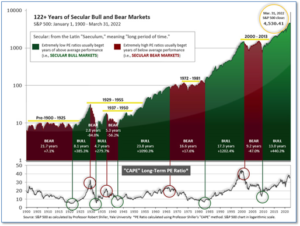
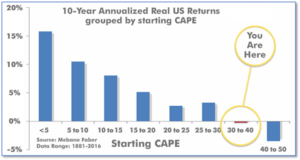
See Fig. 1 for the 100-year view of Secular Bulls and Bears. The CAPE is now at 31.68, down from the prior week’s 32.46. Since 1881, the average annual return for all ten-year periods that began with a CAPE in this range has been negative (see Fig. 2).
Note: We do not use CAPE as an official input into our methods. However, if history is any guide – and history is typically ‘some’ kind of guide – it’s always good to simply know where we are on the historic continuum, where that may lead, and what sort of expectations one may wish to hold in order to craft an investment strategy that works in any market ‘season’ … whether the current one, or one that may be ‘coming soon’!
The Big Picture:
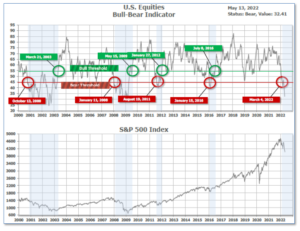
The ‘big picture’ is the (typically) years-long timeframe – the timeframe in which Cyclical Bulls and Bears operate. The U.S. Bull-Bear Indicator finished the week in Bear territory at 32.41, down from the prior week’s 35.22.
In the Quarterly- and Shorter-term Pictures
The Quarterly-Trend Indicator based on the combination of U.S. and International Equities trend-statuses at the start of each quarter – was Negative entering April, indicating negative prospects for equities in the second quarter of 2022.
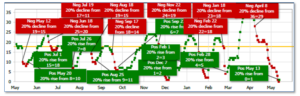
Next, the short-term(weeks to months) Indicator for US Equities turned positive on May 13, and ended the week at 1, down from the prior week’s 7, but up from the low of 0.
In the Markets:
U.S. Markets: Despite an end-of-week rally, the major U.S. equity benchmarks recorded another week of losses. It marked the sixth consecutive weekly decline for the both the S&P 500 index and the Nasdaq Composite, and the seventh for the Dow Jones Industrial Average—its longest stretch since 2001. At its lows on Thursday, the S&P 500 was down nearly 18% from its peak, just above the -20% threshold that commonly defines a bear market. The Dow Jones Industrial Average shed 703 points finishing the week at 32,197—a decline of -2.1%. The technology-heavy NASDAQ Composite retreated ‑2.8% to close at 11,805. By market cap, the large cap S&P 500 retreated -2.4%, the mid cap S&P 400 declined -2.0%, and the small cap Russell 2000 gave up -2.5%.
International Markets: Major international markets finished the week mixed. Canada’s TSX retreated -2.6%, while the United Kingdom’s FTSE 100 ticked up 0.4%. On Europe’s mainland, France’s CAC 40 and Germany’s DAX rose 1.7% and 2.6%, respectively. In Asia, China’s Shanghai Composite gained 2.8%, while Japan’s Nikkei ended the week down -2.1%. As grouped by Morgan Stanley Capital International, developed markets ended the week down -0.4%. Emerging markets fell -1.1%.
Commodities: Precious metals had a difficult week with Gold retreating -4.0% to $1808.20 an ounce, and Silver plunged -6.1% to $21. Energy finished the week mixed with West Texas Intermediate crude oil rising 0.7% to $110.49 per barrel, while Brent crude shed -0.9% to $111.41. The industrial metal copper, viewed by some analysts as a barometer of world economic health due to its wide variety of uses, ended the week down -2.2%.
U.S. Economic News: The number of Americans filing for first-time unemployment benefits rose slightly last week, settling just above 200,000. The Labor Department reported initial jobless claims rose by 1,000 to 203,000. Economists had expected new claims to fall to 194,000. The reading followed a revised increase of 21,000 last week to 202,000—the biggest weekly increase since last July. Meanwhile, continuing claims, which counts the number of people already receiving benefits, fell by 44,000 to 1.34 million. That number remains near its lowest level since early 1970.
Inflation remained near a 40-year high in April but pulled back slightly from the previous month. The Bureau of Labor Statistics reported the Consumer Price Index showed an 8.3% year-over-year increase last month–a slight decline from March’s 8.5% increase. However, even though inflation slowed a bit, the reading was higher than expected and inflation was widespread across the economy. Core inflation, which strips out the often-volatile food and energy categories, was also higher than anticipated. Core inflation rose by 0.6%, 0.2% higher than forecast. The Federal Reserve views the core CPI as a more accurate measure of inflationary trends, but most Americans still pay a large share of their budget for fuel and meals. Of note, food prices jumped almost 1% last month. Grocery prices have increased 10.8% in the past year, the biggest surge since 1981. Sal Gautieri, senior economist at BMO Capital Markets wrote in a note, “The Fed has little option but to keep jacking up interest rates to at least neutral levels as fast as possible.”
Inflation at the wholesale level rose 11% in April as prices at the producer level continue to accelerate. The Bureau of Labor Statistics reported its Producer Price Index (PPI) rose 0.5% on the month, and 11% from a year ago, indicating that inflation at the consumer level is unlikely to decline anytime soon. Excluding food, energy and trade services, “core” PPI rose 0.6% in April and 6.9% from the same time last year. That reading is a slight decline from the 7.1% annual rate last month. Both monthly readings were in line with economists’ estimates. Gas and groceries have been responsible for much of the inflation surge, with indexes tracking those two sectors up a respective 1.7% and 1.5% in April, according to the PPI data. Auto prices, particularly for used vehicles, also have been a major inflation component, and the PPI index for motor vehicles and equipment increased 0.8% on the month.
Confidence among the nation’s small business owners leveled off last month, after three consecutive months of declines. The National Federation of Independent Businesses (NFIB) reported its Small Business Optimism Index remained unchanged at 93.2 in April. That remains near its lowest level since April 2020, just after the coronavirus pandemic took hold. Inflation and labor shortages continued to weigh heavily on short-term expectations. However, the future doesn’t appear bright to the nation’s small business owners. The number of respondents who expect better business conditions in the next six months continued to decline, hitting its lowest level ever recorded in the survey’s history. “Owners are very pessimistic about sales and business conditions in the second half of the year,” NFIB Chief Economist Bill Dunkelberg said. “This dampens capital investment and, eventually, will feed into employment if sales actually slow as expected,” he said. Small businesses account for nearly half of all private sector jobs.
The sentiment of the nation’s consumers fell to a 10-year low, according to the University of Michigan. In its preliminary reading of consumer sentiment for early May, the University of Michigan reported its gauge fell to 59.1 in May, from April’s final reading of 65.2. Economists were expecting a reading of 64.1. Joanne Hsu, director of the survey, stated the decline in consumer attitudes from April “were broad based” and “visible across income, age, education, geography, and political affiliation.” “Consumers’ assessment of their current financial situation relative to a year ago is at its lowest reading since 2013, with 36% of consumers attributing their negative assessment to inflation,” Hsu added. The report’s indicator of expectations for the next six months declined to 56.3 from 62.5.
International Economic News: Canada’s Prime Minister Justin Trudeau pushed back against comments made by one of the leading candidates for the Conservative Party of Canada, Pierre Poilievre. Poilievre had pledged to replace the governor of the Bank of Canada, Tiff Macklem, with someone who has a low-inflation mandate. Poilievre’s criticism of Canada’s central bank has been a key pillar of his leadership campaign. Trudeau responded saying the Bank of Canada is one of the “strongest, most stable, most reputable banking systems in the world,” and that its independence from the government is “a really important principle.”
Across the Atlantic, a growth slowdown is underway in the United Kingdom after the economy contracted by 0.1% in March and one analyst states its “only going to get worse.” Although the U.K.’s economy grew 0.8% in the first quarter, January was the only positive month. The war in Ukraine, supply chain issues, and energy price spikes have all compounded the inflation that was already underway lifting it to a multi-decade high. Hinesh Patel, portfolio manager at Quilter Investors stated, “Ultimately, things are only going to get worse for consumers. Energy bills are expected to soar again later this year when the price cap is reassessed, while inflation is proving stickier than expected.” U.K inflation hit a 30-year high of 7% in March and in April, the country’s energy regulator increased its price cap by 54% to accommodate soaring prices.
On Europe’s mainland, a sudden Russian gas embargo would inflict a new economic crisis on the German economy a recent study showed. The IMK Institute stated an abrupt stop in deliveries of Russian natural gas could trigger a recession in Germany comparable with the economic crisis years of 2020 and 2009, if not worse. Such an embargo would lead to a fall in production in the first 12 months of between 114 billion euros ($120 billion) and 286 billion euros, corresponding to about 3%-8% of gross domestic product (GDP), the IMK institute said. The study’s lead author Tom Krebs warned it “could also lead to an economic crisis the likes of which (West) Germany has not seen since World War Two.”
In Asia, the economic toll of China’s latest coronavirus outbreak is ’10 times more severe’ than the Wuhan outbreak of 2020 a top economist warned. A leading Chinese economic professor, Xu Jianguo, stated China’s strict ‘zero-COVID’ policy has already cost China 18 trillion yuan ($2.68 trillion USD). China has set an economic growth target of 5.5% this year, but Jianguo doubts the country will be able to match its 2020 growth of just 2.3%. China, a predominantly export market, has been unable to sell many of its goods abroad due to Covid-19 restrictions stopping ships from moving in and out of ports such as the one in Shanghai—a city where 26 million people haven’t been able to leave their homes. More than 160 million people have been in lockdown so far in 2022.
Japan’s lawmakers have enacted legislation aimed at strengthening the country’s economic security. The law will allow for the investigation of suppliers of certain products once they are designated as vital to people’s lives, for example semiconductors and pharmaceuticals. The sweeping legislation also aims to prevent cyberattacks on infrastructure systems by screening companies that handle telecommunications and electricity equipment that’s deemed important. Japan’s government is moving to tighten economic security as supply chains of products such as semiconductors, face masks and medical equipment are expanding globally.
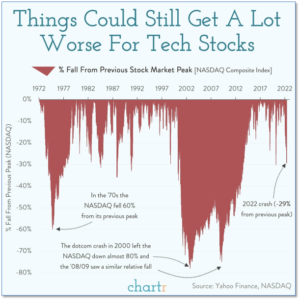
Finally: Usually it’s a newsworthy event when the price of a well-known tech company falls by more than 10% in a week’s time. However, in the last few weeks almost every single day has seen multiple major technology bellwethers taking double-digit losses. So how bad can this get? Analysts at Chartr combed through 50 years of daily data from the NASDAQ Composite to get perspective on how bad the current sell-off has been—and how much worse could it get. So far the NASDAQ is down 29% from its previous peak—officially in bear market territory. However, this decline isn’t even close to the 70%-80% declines seen during the bursting of the dot.com bubble in 2000 and the financial crisis of 2008. (Chart by chartr.co)
(Sources: All index- and returns-data from Yahoo Finance; news from Reuters, Barron’s, Wall St. Journal, Bloomberg.com, ft.com, guggenheimpartners.com, zerohedge.com, ritholtz.com, markit.com, financialpost.com, Eurostat,0020Statistics Canada, Yahoo! Finance, stocksandnews.com, marketwatch.com, wantchinatimes.com, BBC, 361capital.com, pensionpartners.com, cnbc.com, FactSet.) Securities offered through Registered Representatives of Cambridge Investment Research Inc., a broker-dealer, member FINRA/SIPC. Advisory Services offered through Cambridge Investment Research Advisors, a Registered Investment Adviser. Strategic Investment Partners and Cambridge are not affiliated. Indices mentioned are unmanaged and cannot be invested into directly. Past performance is no guarantee of future results.