
4-3-2023 Weekly Market Update
The very Big Picture
The long-term valuation of the market is commonly measured by the Cyclically Adjusted Price to Earnings ratio, or “CAPE”, which smooths-out shorter-term earnings swings in order to get a longer-term assessment of market valuation. A CAPE level of 30 is considered to be the upper end of the normal range, and the level at which further PE-ratio expansion comes to a halt (meaning that further increases in market prices only occur as a general response to earnings increases, instead of rising “just because”). The market was recently above that level, and has fallen back.
Of course, a “mania” could come along and drive prices higher – much higher, even – and for some years to come. Manias occur when valuation no longer seems to matter, and caution is thrown completely to the wind – as buyers rush in to buy first, and ask questions later. Two manias in the last century – the “Roaring Twenties” of the 1920s, and the “Tech Bubble” of the late 1990s – show that the sky is the limit when common sense is overcome by a blind desire to buy. But, of course, the piper must be paid, and the following decade or two were spent in Secular Bear Markets, giving most or all of the mania-gains back.
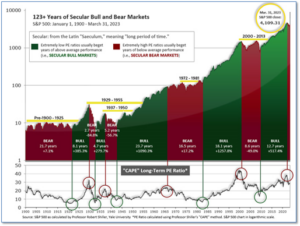
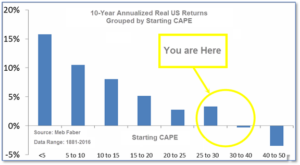
See Fig. 1 for the 100-year view of Secular Bulls and Bears. The CAPE is now at 29.35, up from the prior week’s 28.84. Since 1881, the average annual return for all ten-year periods that began with a CAPE in this range has been slightly positive to slightly negative (see Fig. 2).
Note: We do not use CAPE as an official input into our methods. However, if history is any guide – and history is typically ‘some’ kind of guide – it’s always good to simply know where we are on the historic continuum, where that may lead, and what sort of expectations one may wish to hold in order to craft an investment strategy that works in any market ‘season’ … whether the current one, or one that may be ‘coming soon’!
The Big Picture:
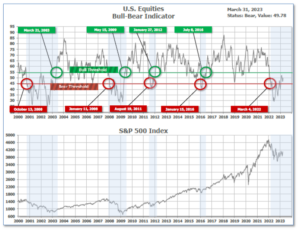
The ‘big picture’ is the (typically) years-long timeframe – the timeframe in which Cyclical Bulls and Bears operate. The U.S. Bull-Bear Indicator finished the week in Bear territory at 49.78, up from the prior week’s 47.33.
In the Quarterly- and Shorter-term Pictures
The Quarterly-Trend Indicator based on the combination of U.S. and International Equities trend-statuses at the start of each quarter – was Positive entering April, indicating positive prospects for equities in the second quarter.
Next, the short-term(weeks to months) Indicator for US Equities turned positive on March 21, and ended the week at 8, up from the prior week’s 3.
In the Markets:
U.S. Markets: The major equity indexes posted solid gains in a relatively quiet week for economic data releases and financial news. Small-caps outperformed large-caps, and value stocks advanced modestly more than growth stocks. The week also brought the end of the first quarter of 2023. The technology-heavy Nasdaq Composite jumped more than 16% for the quarter, while the broad market S&P 500 Index rose approximately 7%. However, the narrowly focused large-cap Dow Jones Industrial Average was only modestly higher.
| Date | Name | Friday’s Close | % Change Wk | % Change March | % Change QTR |
| 3/31/2023 | DJIA | 33274 | 3.2 | 1.9 | 0.4 |
| 3/31/2023 | Nasdaq | 12222 | 3.4 | 6.7 | 16.8 |
| 3/31/2023 | Russell 2000 Index | 1802 | 3.9 | -5 | 2.3 |
| 3/31/2023 | S&P 500 Index | 4109 | 3.5 | 3.5 | 7 |
| 3/31/2023 | S&P MidCap 400 Index | 2512 | 4.5 | -3.4 | 3.4 |
International Markets: Major international markets finished the week (and the quarter) predominantly to the upside as well. France and Germany led the way rising 4.4% and 4.5% respectively, while Japan and China lagged. As grouped by Morgan Stanley Capital International, developed markets finished the week up 3.9%, emerging markets added 2%.
| Date | Name | Friday’s Close | % Change Wk | % Change March | % Change QTR |
| 3/31/2023 | CAC 40 Index | 7322 | 4.4 | 0.7 | 13.1 |
| 3/31/2023 | DAX Index | 15629 | 4.5 | 1.7 | 12.2 |
| 3/31/2023 | FTSE 100 Index | 7632 | 3.1 | -3.1 | 2.4 |
| 3/31/2023 | Nikkei 225 Index | 28041 | 2.4 | 2.2 | 7.5 |
| 3/31/2023 | TSX Composite Index | 20100 | 3.1 | -0.6 | 3.7 |
| 3/31/2023 | Shanghai Stock Exchange | 3273 | 0.2 | -0.2 | 5.9 |
| 3/31/2023 | MSCI Emerging Markets | 39 | 2 | 3.2 | 9 |
| 3/31/2023 | MSCI EAFE ETF | 72 | 3.9 | 3.1 | 4.1 |
Commodities: Precious metals finished the week to the upside. Gold ticked up 0.1% to $1986.20 per ounce, while Silver rose 3.5% to $24.16. West Texas Intermediate crude oil surged 9.3% to $75.67 per barrel, while the industrial metal copper finished the week up 0.5%. In the month of March, Silver surged 14.6%, followed by Gold (+8.1%), and Copper (+0.1%). Oil ended the month down -1.8%. In the first quarter, Gold added 8.8%, Copper rose 7.5%, and Silver ticked up 0.5%. Crude oil ended the first quarter down -5.7%.
U.S. Economic News: The number of Americans filing first-time unemployment benefits rose to a three-week high, but remained near historically-low levels. The Labor Department reported initial jobless claims increased by 7,000 to 198,000 last week. New unemployment filings have come in less than 200,000 in 10 of the last 11 weeks—an unusually long stretch. Economists had expected new claims to total 195,000. Thirty of the 53 U.S. states and territories that report jobless claims showed a decrease last week, while 23 posted an increase. Meanwhile, continuing claims, which counts the number of Americans already receiving benefits, ticked up by 4,000 to 1.69 million. That number also remains near historic lows.
Home prices pulled back in January as buyers continued to be pressed between high home prices and rising mortgage rates. S&P CoreLogic reported its Case-Shiller 20-city home price index fell 0.4% in January—its seventh decline in a row. Still, year-over-year home prices are still up 2.5%, down from 4.6% in the previous month. S&P’s broader national home price index fell 0.2% in January. Miami, Tampa and Atlanta reported the highest year-over-year gains among the 20 cities in January. San Francisco, Seattle and Portland reported the lowest year-over-year gains. However, on a monthly basis, all 20 cities reported lower price increases on a monthly basis in January.
The number of home transactions in which a contract has been signed but not yet closed rose for a third month in a row in February, the National Association of Realtors (NAR) reported. Pending home sales rose 0.8% last month. The figure beat Wall Street’s expectations of a 3% decline. However, compared to the same time last year, sales were down by 21.1%. Pending home sales rose in all but one region—the West, which pulled back 2.4%. Given the data, NAR Chief Economist Lawrence Yun stated, “After nearly a year, the housing sector’s contraction is coming to an end.” “Existing-home sales, pending contracts and new-home construction pending contracts have turned the corner and climbed for the past three months,” he added.
Confidence among the nation’s consumers picked up in March on hopes of an improving economy, however inflation remains a big concern. The Conference Board reported its survey of consumer confidence rebounded 0.8 points to 104.2. Economists had expected a reading of 100.7. In the report, most of the improvement was because Americans were slightly more optimistic about the future. The measure that looks ahead six months rose to 73 from a six-month low of 70.4, while the measure that looks at how consumers feel about the economy right now ticked down 1.9 points to 151.1. Ataman Ozyildirim, senior director of economics at the board stated, “While consumers feel a bit more confident about what’s ahead, they are slightly less optimistic about the current landscape.”
One measure of the cost of goods and services rose just slightly in February, a positive development in the Federal Reserve’s fight against inflation. The Personal Consumption Expenditures Index, rumored to be the Federal Reserve’s “preferred” inflation gauge, ticked up 0.3% down from its sharp 0.6% spike in January. In addition, the yearly increase in prices declined to 5% from 5.3% in the prior month, marking its lowest level in more than a year and a half. Unlike the more popular Consumer Price Index (CPI) the PCE takes into account how consumers change their buying habits due to rising prices. Analysts welcomed the report with Robert Frick, corporate economist at Navy Federal Credit Union writing, “For an economy looking to avoid recession, this was a good report.”
International Economic News: Following a small contraction in December, Canada’s economy returned to growth in January according to Statistics Canada. Real gross domestic product rose 0.5% at the start of the year, beating the initial estimate of a 0.3% gain. The agency also reaffirmed its initial estimate for February of 0.3% growth. BMO chief economist Douglas Porter wrote in a report, “There were many indications that the economy got off to a solid start in 2023, but today’s double-barreled blast of strength is well above even the most optimistic views.” The growth in January came as goods-producing industries gained 0.4% for the month, while services-producing industries rose 0.6%.
Across the Atlantic, Britain’s economy avoided a recession as it grew in the final months of last year, according to official data. The United Kingdom’s Office for National Statistics reported GDP increased by 0.1% in the fourth quarter of last year. Third quarter GDP was also revised lower to show a 0.1% contraction—smaller than initially thought. Investec economist Philip Shaw wrote, “The latest release takes the UK a little further away from the recessionary danger zone although the report does not change the overall picture that the economy’s performance was lackluster over the second half of 2022.”
On Europe’s mainland, inflation in France eased for the first time in three months as energy prices continued to retreat. Consumer prices advanced 6.6% in March, down from a record 7.3% in February. French households report their assessment of recent price increases at the highest since the 1970s. Still, consumers may believe the worst may be over as expectations of future prices have begun to fall. Separate data from French statistics agency INSEE showed a 0.8% drop in consumer spending as households cut back spending on food and manufactured goods.
Europe’s economic powerhouse, Germany, will gradually recover in the second half of this year, according to KPMG’s Global Economic Outlook report. Inflation will fall in the medium term while the labor market will remain robust and stabilize private consumption, it said. Last year, the war in Ukraine, supply chain disruptions and energy shortages due to Russian sanctions all weighed on the German economy. Relief packages from the German government, particularly in the form of the gas and electricity price brakes, could save the German economy from a recession in 2023, it noted. Overall, KPMG expects economic activity to gradually stabilize in 2023 and continue to grow in 2024.
As trade and geopolitical tensions with the West continue to grow, Chinese Premier Li Qiang stated his commitment to open and reform the world’s second-largest economy to a group of foreign executives, including Apple Inc’s Tim Cook. At a summit in Beijing Li proclaimed, “A confident, open, and willing to share China must be a huge force for world prosperity and stability.” Beijing’s overtures to overseas firms comes at a time of escalating rhetoric with China’s largest export market, the U.S. Taiwan President Tsai Ing-wen arrived in New York for the first of two U.S. stops, which Beijing has deemed as provocative. Li said “chaos and conflicts” must not happen in Asia and that China would act as an “anchor” for global peace.
Bank of Japan Governor Haruhiko Kuroda’s term is set to expire next week, and his successor Kazuo Ueda is expected to dismantle his legacy. Ueda is expected to end Japan’s audacious easy-money experiment, bringing an end to a decade of ultralow interest rates that punished domestic savers and sent Japanese money overseas in search of better returns. A reversal in that flow of funds has already begun. Japanese investors sold a record amount of overseas debt last year. Jeffrey Atherton, portfolio manager at Man GLG stated, “It would be logical for them to bring the money home and not to take the foreign exchange risk.”
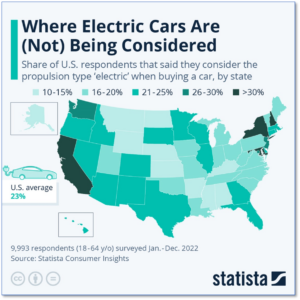
Finally: For those in the market for a new vehicle recent data shows that where one lives plays a large part in whether they’re considering an electric vehicle. Statista Consumer Insights found that in California, the state at the forefront of the electric car revolution, over 30% of respondents stated they’re considering an ‘electric propulsion type’ when buying a car. On the other hand, North Dakotans and Alaskans showed very little interest in considering electric cars as a viable transportation option. (Chart from Statista.com)
(Sources: All index- and returns-data from Yahoo Finance; news from Reuters, Barron’s, Wall St. Journal, Bloomberg.com, ft.com, guggenheimpartners.com, zerohedge.com, ritholtz.com, markit.com, financialpost.com, Eurostat, Statistics Canada, Yahoo! Finance, stocksandnews.com, marketwatch.com, wantchinatimes.com, BBC, 361capital.com, pensionpartners.com, cnbc.com, FactSet.) Content provided by WE Sherman and Company. Securities offered through Registered Representatives of Cambridge Investment Research Inc., a broker-dealer, member FINRA/SIPC. Advisory Services offered through Cambridge Investment Research Advisors, a Registered Investment Adviser. Strategic Investment Partners and Cambridge are not affiliated. Indices mentioned are unmanaged and cannot be invested into directly. Past performance is no guarantee of future results. These opinions of Strategic Investment Partners and not necessarily those of Cambridge Investment Research, are for informational purposes only and should not be construed or acted upon as individualized investment advice.