
3-26-2023 Weekly Market Update
The very Big Picture
The long-term valuation of the market is commonly measured by the Cyclically Adjusted Price to Earnings ratio, or “CAPE”, which smooths-out shorter-term earnings swings in order to get a longer-term assessment of market valuation. A CAPE level of 30 is considered to be the upper end of the normal range, and the level at which further PE-ratio expansion comes to a halt (meaning that further increases in market prices only occur as a general response to earnings increases, instead of rising “just because”). The market was recently above that level, and has fallen back.
Of course, a “mania” could come along and drive prices higher – much higher, even – and for some years to come. Manias occur when valuation no longer seems to matter, and caution is thrown completely to the wind – as buyers rush in to buy first, and ask questions later. Two manias in the last century – the “Roaring Twenties” of the 1920s, and the “Tech Bubble” of the late 1990s – show that the sky is the limit when common sense is overcome by a blind desire to buy. But, of course, the piper must be paid, and the following decade or two were spent in Secular Bear Markets, giving most or all of the mania-gains back.
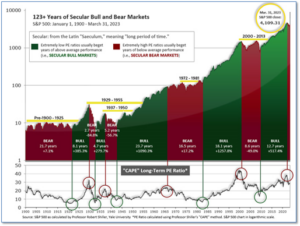
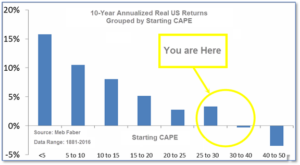
See Fig. 1 for the 100-year view of Secular Bulls and Bears. The CAPE is now at 28.36, up from the prior week’s 27.97. Since 1881, the average annual return for all ten-year periods that began with a CAPE in this range has been slightly positive to slightly negative (see Fig. 2).
Note: We do not use CAPE as an official input into our methods. However, if history is any guide – and history is typically ‘some’ kind of guide – it’s always good to simply know where we are on the historic continuum, where that may lead, and what sort of expectations one may wish to hold in order to craft an investment strategy that works in any market ‘season’ … whether the current one, or one that may be ‘coming soon’!
The Big Picture:
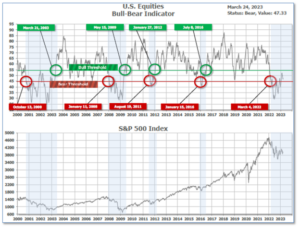
The ‘big picture’ is the (typically) years-long timeframe – the timeframe in which Cyclical Bulls and Bears operate. The U.S. Bull-Bear Indicator finished the week in Bear territory at 47.33, up from the prior week’s 46.76.
In the Quarterly- and Shorter-term Pictures
The Quarterly-Trend Indicator based on the combination of U.S. and International Equities trend-statuses at the start of each quarter – was Positive entering January, indicating positive prospects for equities in the first quarter of 2023.
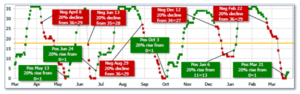
Next, the short-term(weeks to months) Indicator for US Equities turned positive on March 21, and ended the week at 3, up from the prior week’s 0.
In the Markets:
U.S. Markets: The major U.S. stock indexes finished the week to the upside as recession worries and stress in the banking sector ebbed a bit. The Dow Jones Industrial Average rose 376 points last week finishing at 32,238, a gain of 1.2%. The technology-heavy NASDAQ Composite rose for a second consecutive week adding 1.7%. By market cap, the large cap S&P 500 rose 1.4%, while the mid cap S&P 400 and small cap Russell 2000 finished the week up 1.3% and 0.5% respectively.
International Markets: Major international financial markets finished in the green as well. Canada’s TSX added 0.6% while the United Kingdom’s FTSE 100 rose 1%. France’s CAC and Germany’s DAX each added 1.3%. In Asia, China’s Shanghai Composite gained 0.5%, while Japan’s Nikkei ticked up 0.2%. As grouped by Morgan Stanley Capital International, developed markets finished up 2.4% and emerging markets gained 2.8%.
Commodities: Precious metals finished the week to the upside. Gold gained 0.5% to $1983.80 per ounce, while Silver jumped 3.9% to $23.34. West Texas Intermediate crude oil rose 3.5% to $69.26 per barrel. The industrial metal copper, viewed by some analysts as a barometer of world economic health due to its wide variety of industrial uses, finished the week up 4.7%.
U.S. Economic News: The number of Americans filing for first-time unemployment benefits fell again to a three-week low of 191,000 last week, signaling the U.S. labor market remains robust despite the strains in the banking sector. The Labor Department reported initial jobless claims fell by 1,000 to 191,000, remaining near historically low levels. Economists had forecast claims to total 198,000. In the details, twenty-eight of the 53 U.S. states and territories that report jobless claims showed a decrease last week. Twenty-five posted an increase. Meanwhile, the number of people already collecting benefits rose by 14,000 to 1.69 million. These continuing claims are still low, but a gradual increase since last year suggests it’s taking longer for people who lose their jobs to find new ones.
For the first time in a little over a year, sales of existing homes rose in February. The National Association of Realtors (NAR) reported home sales jumped 14.5% to an annual rate of 4.58 million last month, helped by a brief drop in mortgage rates. The increase of 14.5% is the largest since July 2020, during the pandemic. Economists had been expecting sales to total 4.2 million. Still, compared with February of 2021, home sales are still down by 22.6%. The median price for an existing home fell slightly to $363,000 in February. Expressed in terms of the number of months-supply, there was a 2.6-month supply of homes for sale in February, down from January. Before the pandemic, a four or five-month supply was more the norm. Stephen Stanley, chief U.S. economist at Santander U.S. Capital Markets, wrote in a note, “The existing home sales figure for February likely benefited from lower borrowing costs as well as an unusually warm winter.” “Of course, both of these forces will be fleeting,” he concluded.
The Federal Reserve raised interest rates a quarter of a percentage point as the failure of Silicon Valley Bank forced the central bank to slow its fight against stubbornly high inflation. The Fed lifted its benchmark federal funds rate to a nearly 16-year high of 4.75%-5%. Just one year ago, that rate was close to zero. Chief economist Avery Shenfeld of CIBC World Markets summed up the move stating, “The Fed decided that it could indeed walk and chew gum at the same time, pressing on with a quarter point rate hike to quell inflation, and clearly relying on its lending facilities to address concerns over financial system stability.” Inside the Fed, members were divided over how to proceed. Seven of 18 Fed officials penciled in two rate hikes to come by year-end. Ten saw just one more rate hike this year, however. As a result, the central bank’s updated “dot plot” forecast now shows the Fed raising rates just one more time this year to a range of 5%-to-5.25% range.
Orders for goods expected to last at least three years, so-called ‘durable goods’, fell last month, primarily because of less demand for passenger planes and new vehicles. Durable goods orders fell 1% in February, worse than the -0.3% decline economists expected. Still, business investment rose for the second month in a row, a sign the industrial side of the economy is still growing. Over the past 12 months, orders are up 2.3%–its smallest year-over-year increase since 2020. Excluding military spending and the auto and aerospace industries, “core” orders were up 0.2%. Economist Stephen Stanley at Santander Capital Markets wrote in a note to clients, “Business investment is definitely a vulnerability for the economy in the event of a severe tightening in credit conditions. Thus, it will be important to watch these numbers going forward.”
According to a pair of reports from S&P Global, the U.S. economy accelerated in March, but so did inflation. In its preliminary “flash” report, S&P Global stated its services-sector index rose to an 11-month high of 53.8 from 50.5 in the prior month. The services side accounts for about 70% of the U.S. economy. The S&P Global manufacturing sector index, meanwhile, increased 2 points to 49.3. That reading is a five-month high. On the downside, the increase in demand allowed companies to raise prices at the fastest pace in five months. Business leaders said rising costs, especially labor, contributed to their decision to raise prices.
International Economic News: The Bank of Canada (BoC) remains concerned that with the labor market being tight, it will be difficult to control inflation as long as the economy is still experiencing surplus demand. BoC policymakers posited that sustained growth in government spending that outpaces economic growth would “boost domestic demand” driving inflation. Finance Minister Chrystia Freeland said the government is not looking to “pour fuel on the fire of inflation” and complicate the BoC’s efforts to restore price stability. She added that the government will provide “targeted” inflation relief to vulnerable Canadians.
Across the Atlantic, President Emmanuel Macron requested to postpone King Charles III’s state visit to France due to violent pension protests. Macron said it would be insensible for King Charles to visit while unions called for protests and that, “common sense and friendship led us to suggest a postponement.” Protests broke out when President Macron and his cabinet used constitutional power to bypass a vote of the National Assembly. Paris and Bordeaux, cities listed on the itinerary, were both caught up in violence last week. According to Buckingham Palace, the decision to postpone the King’s three-day visit to France was due to the “situation in France.” Interior Minister Gérald Darmanin said 903 fires were lit in Paris where garbage had been left uncollected for weeks.
Germany, Europe’s largest economy, is heading towards contraction in the first quarter according to its central bank, the Bundesbank. Germany’s industrial sector was starting to recover from its 0.4% contraction in the fourth quarter of last year, but high inflation continues to weigh heavily on consumption. “German economic activity will probably fall again in the current quarter,” the Bundesbank said. “However, the decline is likely to be less than in the final quarter of 2022.”
In Asia, research firm Wood Mackenzie released a report noting China’s reopening is the “single biggest demand driver” for a recovery in oil demand and it expects the country will make up nearly 40% of the rise in global oil demand in 2023. “A return to normal mobility in China is the single biggest demand driver, accounting for 1.0 million barrels per day (b/d) of the 2.6 million b/d increase this year,” the team of analysts wrote. Chinese President Xi Jinping in his recent visit to Moscow affirmed economic cooperation with Russian President Vladimir Putin for the next several years, including on energy security. This followed his trip to Saudi Arabia, where Xi stressed the importance of stability in the oil market.
A measure of Japan’s core consumer price index, which excludes fresh food and fuel, rose 3.5% in February from a year earlier, accelerating 0.3% from last month’s reading. The index, dubbed “core-core” CPI and closely watched by the BOJ as an indicator of price moves reflecting demand, marked the fastest year-on-year increase since January 1982. “Inflationary pressure remains strong,” said Yoshiki Shinke, chief economist at Dai-ichi Life Research Institute. “Many food producers have announced plans to hike prices further in March.” Furthermore, in labor talks with unions earlier this month, top Japanese companies agreed to their largest pay increases in a quarter century—a sign that the country’s deflationary mindset is, most likely, over.
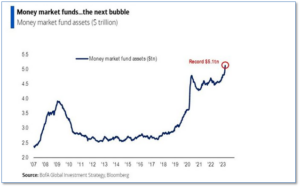
Finally: A team of analysts at Bank of America led by Michael Hartnett released a report showing yet another financial bubble has emerged courtesy of the crisis in the banking sector. According to Hartnett, money-market funds are the hot new asset. They point out money fund assets under management just hit a record $5.1 trillion, up over $300 billion over the past four weeks alone. The last two times money-market fund assets surged, in 2008 and 2020, equity markets plunged, and the Federal Reserve was forced to slash interest rates to quell the panic. As Hartnett notes, “markets stop panicking when central banks start panicking.” (Chart from Bank of America)
(Sources: All index- and returns-data from Yahoo Finance; news from Reuters, Barron’s, Wall St. Journal, Bloomberg.com, ft.com, guggenheimpartners.com, zerohedge.com, ritholtz.com, markit.com, financialpost.com, Eurostat, Statistics Canada, Yahoo! Finance, stocksandnews.com, marketwatch.com, wantchinatimes.com, BBC, 361capital.com, pensionpartners.com, cnbc.com, FactSet.) Content provided by WE Sherman and Company. Securities offered through Registered Representatives of Cambridge Investment Research Inc., a broker-dealer, member FINRA/SIPC. Advisory Services offered through Cambridge Investment Research Advisors, a Registered Investment Adviser. Strategic Investment Partners and Cambridge are not affiliated. Indices mentioned are unmanaged and cannot be invested into directly. Past performance is no guarantee of future results. These opinions of Strategic Investment Partners and not necessarily those of Cambridge Investment Research, are for informational purposes only and should not be construed or acted upon as individualized investment advice.