
4-18-2022 Weekly Market Update
The Very Big Picture
The long-term valuation of the market is commonly measured by the Cyclically Adjusted Price to Earnings ratio, or “CAPE”, which smooths-out shorter-term earnings swings in order to get a longer-term assessment of market valuation. A CAPE level of 30 is considered to be the upper end of the normal range, and the level at which further PE-ratio expansion comes to a halt (meaning that further increases in market prices only occur as a general response to earnings increases, instead of rising “just because”). The market is now above that level.
Of course, a “mania” could come along and drive prices higher – much higher, even – and for some years to come. Manias occur when valuation no longer seems to matter, and caution is thrown completely to the wind – as buyers rush in to buy first, and ask questions later. Two manias in the last century – the “Roaring Twenties” of the 1920s, and the “Tech Bubble” of the late 1990s – show that the sky is the limit when common sense is overcome by a blind desire to buy. But, of course, the piper must be paid, and the following decade or two were spent in Secular Bear Markets, giving most or all of the mania-gains back.
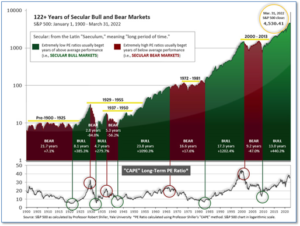
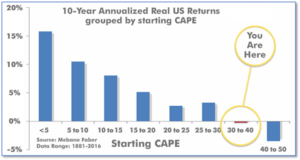
See Fig. 1 for the 100-year view of Secular Bulls and Bears. The CAPE is now at 34.58, down from the prior week’s 36.37. Since 1881, the average annual return for all ten-year periods that began with a CAPE in this range has been negative (see Fig. 2).
Note: We do not use CAPE as an official input into our methods. However, if history is any guide – and history is typically ‘some’ kind of guide – it’s always good to simply know where we are on the historic continuum, where that may lead, and what sort of expectations one may wish to hold in order to craft an investment strategy that works in any market ‘season’ … whether the current one, or one that may be ‘coming soon’!
The Big Picture:
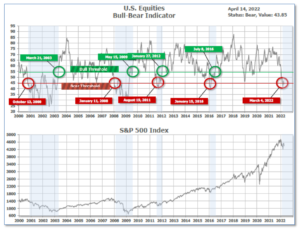
The ‘big picture’ is the (typically) years-long timeframe – the timeframe in which Cyclical Bulls and Bears operate. The U.S. Bull-Bear Indicator finished the week in Bear territory at 43.85, down from the prior week’s 46.03.
In the Quarterly- and Shorter-term Pictures
The Quarterly-Trend Indicator based on the combination of U.S. and International Equities trend-statuses at the start of each quarter – was Negative entering April, indicating negative prospects for equities in the first quarter of 2021.
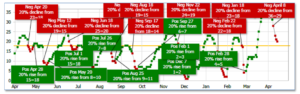
Next, the short-term(weeks to months) Indicator for US Equities turned negative on April 8, and ended the week at 20, down from the prior week’s 28.
In the Markets:
U.S. Markets: The major U.S. indexes ended the week mixed in the first week of major corporate earnings reports for 2022. Value stocks continued to outperform their growth counterparts, while small-caps outpaced large caps. The Dow Jones Industrial Average shed 270 points finishing the week at 34,451—a decline of -0.8%. The technology-heavy NASDAQ Composite fell a second week, falling -2.6% to 13,351. By market cap, the large cap S&P 500 declined -2.1%, while the mid cap S&P 400 and small cap Russell 2000 indexes finished up 0.4% and 0.5%, respectively.
International Markets: International markets finished the week predominantly to the downside. Canada’s TSX ticked down -0.1%, while the United Kingdom’s FTSE 100 gave up -0.7%. France’s CAC 40 gained 0.6%, but Germany’s DAX ended down -0.8%. In Asia, China’s Shanghai Composite ended the week down -0.8% and Japan’s Nikkei retraced some of last week’s decline ending up 0.7%. As grouped by Morgan Stanley Capital International, emerging markets ended the week down -1.6% and developed markets finished down -1.2%.
Commodities: Major commodities finished the week in the green. Gold rose 1.9% to $1974.90 an ounce, while Silver gained 3.9% to $25.70. West Texas Intermediate crude oil surged 11.4% to $106.95 per barrel, while Brent crude added 9.6% to $111.10. The industrial metal copper, viewed by some analysts as a barometer for world economic health due to its wide variety of uses, finished the week up 0.5%.
U.S. Economic News: the number of Americans filing first-time claims for unemployment rose last week after hitting a 54-year low. The Labor Department reported claims rose 18,000 to 185,000. Economists had expected new claims would total just 172,000. Meanwhile, continuing claims, which counts the number of people already receiving benefits, fell by 48,000 to 1.48 million. That number is reported with a one-week lag.
The confidence of America’s small-business owners fell to a one-year low according to the National Federation of Independent Business (NFIB). The group’s optimism index dropped 2.4 points to 93.2. “Inflation continues to be a problem on Main Street, leading more owners to raise selling prices again in February,” NFIB chief economist Bill Dunkelberg said. “Supply chain disruptions and labor shortages also remain problems, leading to lower earnings and sales for many.” A net 72% of owners said they were increasing prices, the highest reading in the history of the survey. Furthermore, owners don’t expect relief anytime soon. The percentage of those who think business will be better six months from now fell 14 points to a new negative 49%–the lowest level recorded in the 48-year-old survey.
The U.S. inflation rate jumped last month to a 40-year high of 8.5% as the price of gasoline, food, housing, and just about everything else rose. The Bureau of Labor Statistics reported CPI rose 1.2% in March—its biggest monthly gain since Hurricane Katrina in 2005. The last time inflation topped 8% was in January 1982, when Ronald Reagan was president. However, some analysts pointed out the “core” rate of inflation, which strips out food and energy, rose just 0.3% last month. That was the smallest increase in that reading in six months. The Fed views the core rate as a more accurate measure of inflationary trends, despite the majority of Americans paying a large share of their budget for fuel and food. The core rate also sits at a 40-year high of 6.5%. Kathy Bostjancic, chief U.S. financial economist at Oxford Economics wrote in a note to clients, “The Russia-Ukraine war has added further fuel to the blazing rate of inflation via higher energy, food, and commodity prices that are turbo charged by a worsening in supply chain problems.”
At the wholesale, or “producer”, level the cost of goods and services jumped 1.4% in March, signaling that high inflation is likely to remain near or above its 40-year highs at least through spring. Economists had expected a 1.1% gain. The increase last month was the largest since the government reformulated the index in 2009—and likely one of the biggest since the early 1980’s. Over the past year wholesale prices have climbed 11.2%, up from 10% in the prior month. Meanwhile, the increase in “core” wholesale prices rose a sharp 0.9%–almost double economists’ forecasts. At least one analyst noted that despite news reports, much of the increase in prices was not due to the conflict in Ukraine. Senior economist Kurt Rankin at PNC Financial Services wrote, “Producer prices rose briskly even outside food and energy, showing increases are not limited to impacts from the Russian invasion.”
Manufacturing activity in the New York-area surged last month according to that region’s central bank. The New York Federal Reserve reported its Empire State Manufacturing survey showed general business conditions jumped 36.4 points to a reading of 24.6 in April from -11.8 in March. Economists had expected a flat reading. In the report, the new-orders index vaulted 36.3 points to 25.1 in April, while the shipments index leapt 41.9 points to 34.5. However, of concern, the prices-paid index rocketed to a record high reading of 86.4. Furthermore, optimism among manufacturers about the next six months declined a sharp 21 points to 15.2—its lowest reading since early in the pandemic.
The nation’s consumers continued to spend last month as inflation rose to its highest level since 1981. The Census Bureau reported retail sales climbed 0.5% from the previous month—slightly less than the 0.6% Dow Jones estimate and a deceleration from the upwardly revised 0.8% gain in February. Retail sales data is not adjusted for inflation. Consequently, the biggest gain in sales for the month came at gas stations, which saw an 8.9% increase in sales as gasoline prices rose 18.3% during the period. By contrast, online sales slumped sharply, falling 6.4% for the month. Overall, retail sales rose 6.9% from the same time last year—a period during which CPI inflation surged 8.5%.
International Economic News: The Bank of Canada announced this week that it increased its interest rate by a half percentage point to 1% amid rising inflation. They also said they will begin a policy of quantitative tightening on April 25, as maturing government bonds will no longer be replaced and because of that, the size of the balance sheet will begin to decline over time. “Price spikes in oil, natural gas and other commodities are adding to inflation around the world,” the news release said. Bank of Canada Governor Tiff Macklem stated, “With inflation well above target, with the economy moving in excess demand, there is a need to normalize monetary policy reasonably quickly and that is reflected in the decision today to raise the policy rate by 50 basis points.” The Bank forecasts that Canada’s economy will grow by 4¼% this year before slowing to 3¼% in 2023 and 2¼% in 2024.
On Europe’s mainland, French ex-president Francois Hollande called on voters to back current incumbent Emmanuel Macron in the second round of the country’s presidential election, stressing that support for the incumbent is the best way “to ensure (Marine) Le Pen does not win”. Macron and Le Pen will face off in France’s presidential election run-off on April 24, with polls pointing to a much tighter race than the lopsided contest that saw Macron easily prevail in 2017. “I am a former president and I know that in an election of this importance, what is key is France, its cohesion, its European future and its independence. This is why I call on the French to vote for Emmanuel Macron,” Hollande, a Socialist, told TF1 television.
In its biannual Joint Economic Forecast, Germany’s biggest economic institutions reduced their GDP forecasts, attributing their downgrade to the war in Ukraine. The RWI in Essen, the DIW in Berlin, the Ifo Institute in Munich, and others now expect German GDP to grow by 2.7% in 2022 and 3.1% in 2023. The institutes had previously projected growth of 4.8% in 2022. Furthermore, Stefan Kooths, research director for business cycles and growth at the Kiel Institute stated, “If [Russian] gas supplies were to be cut off, the German economy would undergo a sharp recession.” Ukrainian President Volodymyr Zelenskyy and the European Parliament have called for the European Union to impose a total embargo on Russian oil, gas and coal imports. However, such a move is expected to have dire economic consequences. Germany bought 58.9% of its natural gas from Russia in 2020, according to the European statistics agency.
In Asia, the People’s Bank of China lowered its reserve requirement ratio (RRR), the amount of cash banks must hold in reserve, by 25 basis points for most banks and 50 basis points for smaller banks, the lowest level since 2007. The change is effective on April 25 and will unleash 530 billion yuan ($83 billion USD) of liquidity into China’s economy. Cutting the RRR is an effective way to unleash cheap long-term liquidity. With local governments speeding up infrastructure bond sales, the cash boost may help banks to finance the surge in bonds. The move itself was not a surprise, as it was widely signaled by China’s State Council. Top Chinese politicians have also repeatedly warned of risks to growth and the need for more monetary and fiscal stimulus as the economic outlook deteriorates.
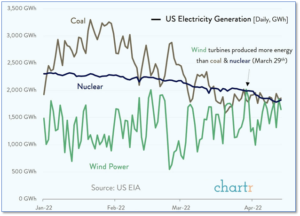
Finally: On a single day earlier this month – and for the first time ever – wind power was the second-largest source of electric generation in the country, behind only natural gas. The Energy Information Administration reported on March 29th that wind turbines produced more energy than both coal and nuclear power. Energy analysts expect that over the coming years, this phenomenon will likely become commonplace as installed wind capacity continues to grow, while use of coal continues to fall. The use of coal for electricity generation is down more than 50% since 2007. (Data from EIA, Chart by chartr.co)
(Sources: All index- and returns-data from Yahoo Finance; news from Reuters, Barron’s, Wall St. Journal, Bloomberg.com, ft.com, guggenheimpartners.com, zerohedge.com, ritholtz.com, markit.com, financialpost.com, Eurostat,0020Statistics Canada, Yahoo! Finance, stocksandnews.com, marketwatch.com, wantchinatimes.com, BBC, 361capital.com, pensionpartners.com, cnbc.com, FactSet.) Securities offered through Registered Representatives of Cambridge Investment Research Inc., a broker-dealer, member FINRA/SIPC. Advisory Services offered through Cambridge Investment Research Advisors, a Registered Investment Adviser. Strategic Investment Partners and Cambridge are not affiliated. Indices mentioned are unmanaged and cannot be invested into directly. Past performance is no guarantee of future results.