4-11-2022 Weekly Market Update
The very Big Picture
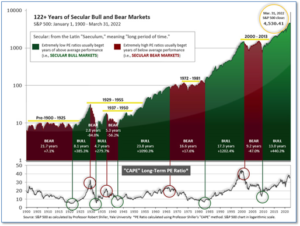
The long-term valuation of the market is commonly measured by the Cyclically Adjusted Price to Earnings ratio, or “CAPE”, which smooths-out shorter-term earnings swings in order to get a longer-term assessment of market valuation. A CAPE level of 30 is considered to be the upper end of the normal range, and the level at which further PE-ratio expansion comes to a halt (meaning that further increases in market prices only occur as a general response to earnings increases, instead of rising “just because”). The market is now above that level.
Of course, a “mania” could come along and drive prices higher – much higher, even – and for some years to come. Manias occur when valuation no longer seems to matter, and caution is thrown completely to the wind – as buyers rush in to buy first, and ask questions later. Two manias in the last century – the “Roaring Twenties” of the 1920s, and the “Tech Bubble” of the late 1990s – show that the sky is the limit when common sense is overcome by a blind desire to buy. But, of course, the piper must be paid, and the following decade or two were spent in Secular Bear Markets, giving most or all of the mania-gains back.

See Fig. 1 for the 100-year view of Secular Bulls and Bears. The CAPE is now at 36.37, down from the prior week’s 36.83. Since 1881, the average annual return for all ten-year periods that began with a CAPE in this range has been negative (see Fig. 2).

Note: We do not use CAPE as an official input into our methods. However, if history is any guide – and history is typically ‘some’ kind of guide – it’s always good to simply know where we are on the historic continuum, where that may lead, and what sort of expectations one may wish to hold in order to craft an investment strategy that works in any market ‘season’ … whether the current one, or one that may be ‘coming soon’!
The Big Picture:
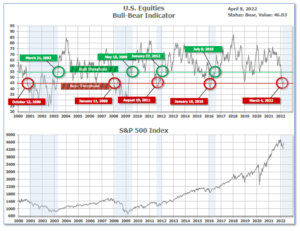
The ‘big picture’ is the (typically) years-long timeframe – the timeframe in which Cyclical Bulls and Bears operate. The U.S. Bull-Bear Indicator finished the week in Bear territory at 46.03, down from the prior week’s 46.96.

In the Quarterly- and Shorter-term Pictures
The Quarterly-Trend Indicator based on the combination of U.S. and International Equities trend-statuses at the start of each quarter – was Positive entering January, indicating positive prospects for equities in the first quarter of 2021.
Next, the short-term(weeks to months) Indicator for US Equities turned negative on April 8, and ended the week at 28, down from the prior week’s 36.

In the Markets:
U.S. Markets: The major U.S. indexes finished the week lower with small caps and growth stocks lagging considerably. Sector performance varied widely within the S&P 500 Index, with the typically defensive consumer staples and health care sectors recording solid gains, while information technology, communication services, and consumer discretionary shares registered steep losses. The Dow Jones Industrial Average shed 97 points to finish the week at 34,721. The technology-heavy NASDAQ Composite declined -3.9% to 13,711, giving up its last two weeks of gains. By market cap, the large cap S&P 500 ended down -1.3%, while the mid cap S&P 400 declined -3.4% and the small-cap Russell 2000 dropped -4.6%.
International Markets: Almost all international markets finished the week in the red. Canada’s TSX shed -0.4%, while the United Kingdom’s FTSE 100 rose 1.7%. After that it was all red ink. France’ CAC 40 and Germany’s DAX declined -2.0% and -1.1%, respectively, while in Asia, China’s Shanghai Composite ended down -0.9%. Japan’s Nikkei fell a second week, giving up -2.5%. As grouped by Morgan Stanley Capital International, developed markets declined -1.9%, and emerging markets finished the week down -2.1%.
Commodities: Commodities were mixed, with Gold rising 1.1% to $1945.60 per ounce and Silver adding 0.7% to $24.82. Oil fell for a second week. West Texas Intermediate crude declined -1% to $98.26 per barrel while Brent ended down -1.9% to $102.78. The industrial metal copper, viewed by some analysts as a barometer of world economic health due to its wide variety of uses, ended the week up 0.8%.
U.S. Economic News: The number of Americans filing first-time unemployment benefits fell to a 54-year low—another sign of the red hot jobs market. The Labor Department reported U.S. initial jobless claims declined by 5,000 to 166,000. That’s the second-lowest reading in history. The only other time jobless claims have been that low was in November of 1968. Economists had expected initial jobless claims to total 200,000. The U.S. jobs market is hopping—literally. Millions of Americans are quitting their jobs to pursue higher paying, better benefits or working conditions (like working from home). It’s great news for workers—wages are rising at their fastest pace in decades. However, not so much for businesses. Costs are going up and businesses still can’t find enough labor to produce enough goods and services to meet high demand. Lead U.S. economist Nancy Vanden Houten of Oxford Economics doesn’t expect the labor market to slow anytime soon. She wrote in a research note, “We expect initial claims to remain well below 200,000 as employers, who continue to struggle to attract and retain workers, will keep layoffs to a minimum.” Meanwhile, the number of people already collecting benefits rose by 17,000 to 1.52 million. That number is reported with a one-week delay.
For the first time in almost a year, factory orders dropped. The Commerce Department reported orders for manufactured goods fell 0.5% in February. It was the first decline in factory orders in ten months. The factory sector has been a bright spot during the pandemic even with the supply chain issues. Economists believe the decline could be a sign that demand may be weakening. Economists had expected a 0.6% decline. In the report, orders for so-called “durable-goods”, goods expected to last at least 3 years, fell 2.1% in February. Orders for non-durable goods were up 1.2%. The closely-watched orders for nondefense capital goods, excluding aircraft, fell a revised 0.2% in February. The reading was up slightly from the prior reading of a 0.3% fall.
The huge ‘services’ side of the U.S. economy grew in March, according to the Institute for Supply Management (ISM). The ISM reported its barometer of business conditions at service-oriented companies such as restaurants and hotels rose 1.8 points to 58.3 in March signaling a faster-expansion in the U.S. economy following the Omicron-induced slowdown earlier in the year. The increase broke a string of three consecutive declines. Numbers over 50 are viewed as positive for the economy and readings above 55 are considered exceptional. A similar ISM survey of manufacturers showed that growth slowed a bit in March, but not enough for alarm. The war in Ukraine added to greater uncertainty for manufacturers, many of which are major exporters. Most service companies are not big exporters. Jennifer Lee of BMO Capital Markets stated, “The ISM survey doesn’t suggest that the U.S. economy is sliding into a recession, but soaring inflation and a Fed that is bent on tightening a lot this year, might have an influence on how activity fares over the next year and half.”
Minutes from the Federal Reserve’s meeting in March showed officials settled on shrinking its balance sheet by $95 billion per month following a three-month “phase-in” period. Officials stressed they made no final decision on winding down the $9 trillion portfolio but said the plan could start in May. The minutes also revealed that many Fed officials signaled they would support 50 basis point rate hikes at upcoming meetings if inflation remains high or gets even worse. “Many” Fed officials wanted a 50-basis point hike in March, but agreed to a smaller 25-basis point increase due to the conflict in Ukraine.
International Economic News: Canada’s unemployment rate fell to a record low of 5.3%–all but guaranteeing Canada’s central bank will hike rates at its next meeting. Nathan Janzen, assistant chief economist at Royal Bank of Canada, wrote in a note to clients, “With the unemployment rate so low, virtually all industries are bumping up against labour shortages, including those hospitality sectors that have yet to fully recover. With (extremely) tight labour markets and above-target inflation, there is no reason for the Bank of Canada to leave interest rates at emergency low levels.” Employment rose by some 73,000 positions in March, Statistics Canada said. The unemployment rate fell from 5.5% in February, which was more than enough to convince most economists that Canada had achieved “full employment,” a theoretical condition where everyone who wants a job can find one.
A month ago it appeared certain that French President Emmanuel Macron would be the first French president to win a second term in 20 years. However, pollsters note that Macron’s lead has all but evaporated with right-wing candidate Marine Le Pen rising sharply in the polls. In the most recent polls, Macron’s lead has shrunk to just a two- to five-point advantage. Le Pen’s National Rally party has a platform focused around putting the well-being of France ahead of the European Union, and an immigration stance that would prioritize the native French for most services such as welfare benefits, housing, jobs, healthcare, and more.
Europe’s economic powerhouse, Germany, could end its reliance on Russian oil this year a leading think-tank reported. The Berlin-based German Institute for Economic Research (DIW) said Germany could kick its dependency on Russian energy imports by winter of this year. That’s considerably sooner than government estimates of mid-2024 or later. DIW outlined a three-pronged approach to achieve the goal—supply diversification, increased storage and pipeline efficiency, and decreased industrial and household consumption. “If potential energy savings are maximized at the same time deliveries from natural-gas-supplying countries is expanded as far as technically possible, German natural gas needs for this year and the coming 2022/2023 winter could be guaranteed without Russian imports,” according to the DIW.
China’s top European business group warned regional and national governments that its “zero-COVID” strategy was harming the attractiveness of Shanghai as a financial hub. China has for the past month been tackling multiple outbreaks with an elimination strategy that seeks to test, trace and centrally quarantine all positive COVID-19 cases. Nomura estimated that a total of 23 Chinese cities have implemented either full or partial lockdowns, which collectively are home to an estimated 193 million people and contribute to 22% of China’s GDP. A growing number of economists have lowered growth forecasts for the first half of 2022, as the COVID surge makes it harder for China to hit its full-year target of around 5.5%. Shanghai-based Bank of Communications cut its forecast for China’s first-quarter GDP growth from 5% to 4%, with the drop coming solely from slowing activity in March, said senior economist Tang Jianwei.
Japan’s Lower House passed a bill promoting economic security this week as the country faces growing geopolitical risks associated with Russia and China. The bill calls for strengthening supply chains to stably procure semiconductors and other vital products and stipulates steps for preventing the leakage of information in the fields of nuclear power and defense. With the new law, Japan seeks to be in step with the United States and European countries, which are more advanced in promoting economic security, as China’s rise has intensified global technology competition – and espionage.
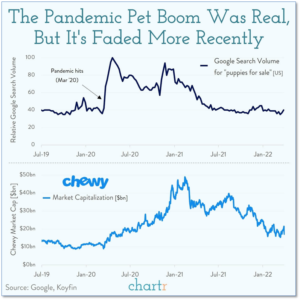
Finally: The COVID pandemic and its subsequent mandatory lockdowns led to greater isolation, greater stress, and less time outside. What better way is there to brighten such a dark time – and occupy bored kids – than to get a puppy! Apparently, millions of Americans thought so too. As households added an additional (furry) mouth to feed, one company in particular stood to benefit. The online pet food and pet supply company Chewy saw its market cap quadruple from the beginning of the pandemic to its peak. Its stock chart shows an almost perfect correlation with Google searches for “puppies for sale”. But now that the number of COVID cases is collapsing—so has Chewy’s stock price. After peaking near $120 a share in February of 2021, Chewy closed this week at $43.19—just a smidge above its IPO price of $35 in 2019. (Chart by chartr.co)

(Sources: All index- and returns-data from Yahoo Finance; news from Reuters, Barron’s, Wall St. Journal, Bloomberg.com, ft.com, guggenheimpartners.com, zerohedge.com, ritholtz.com, markit.com, financialpost.com, Eurostat,0020Statistics Canada, Yahoo! Finance, stocksandnews.com, marketwatch.com, wantchinatimes.com, BBC, 361capital.com, pensionpartners.com, cnbc.com, FactSet.) Securities offered through Registered Representatives of Cambridge Investment Research Inc., a broker-dealer, member FINRA/SIPC. Advisory Services offered through Cambridge Investment Research Advisors, a Registered Investment Adviser. Strategic Investment Partners and Cambridge are not affiliated. Indices mentioned are unmanaged and cannot be invested into directly. Past performance is no guarantee of future results.
