
4-10-2023 Weekly Market Update
The very Big Picture
The long-term valuation of the market is commonly measured by the Cyclically Adjusted Price to Earnings ratio, or “CAPE”, which smooths-out shorter-term earnings swings in order to get a longer-term assessment of market valuation. A CAPE level of 30 is considered to be the upper end of the normal range, and the level at which further PE-ratio expansion comes to a halt (meaning that further increases in market prices only occur as a general response to earnings increases, instead of rising “just because”). The market was recently above that level, and has fallen back.
Of course, a “mania” could come along and drive prices higher – much higher, even – and for some years to come. Manias occur when valuation no longer seems to matter, and caution is thrown completely to the wind – as buyers rush in to buy first, and ask questions later. Two manias in the last century – the “Roaring Twenties” of the 1920s, and the “Tech Bubble” of the late 1990s – show that the sky is the limit when common sense is overcome by a blind desire to buy. But, of course, the piper must be paid, and the following decade or two were spent in Secular Bear Markets, giving most or all of the mania-gains back.
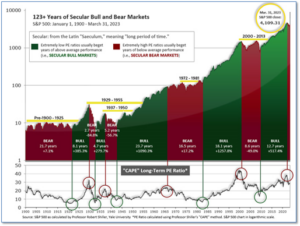
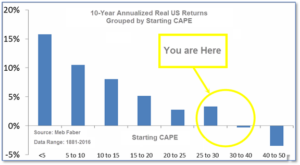
See Fig. 1 for the 100-year view of Secular Bulls and Bears. The CAPE is now at 29.27, down from the prior week’s 29.35. Since 1881, the average annual return for all ten-year periods that began with a CAPE in this range has been slightly positive to slightly negative (see Fig. 2).
Note: We do not use CAPE as an official input into our methods. However, if history is any guide – and history is typically ‘some’ kind of guide – it’s always good to simply know where we are on the historic continuum, where that may lead, and what sort of expectations one may wish to hold in order to craft an investment strategy that works in any market ‘season’ … whether the current one, or one that may be ‘coming soon’!
The Big Picture:
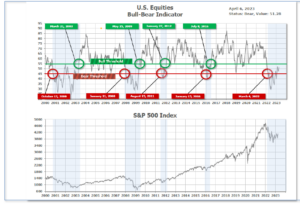
The ‘big picture’ is the (typically) years-long timeframe – the timeframe in which Cyclical Bulls and Bears operate. The U.S. Bull-Bear Indicator finished the week in Bear territory at 51.28, up from the prior week’s 47.33.
In the Quarterly- and Shorter-term Pictures
The Quarterly-Trend Indicator based on the combination of U.S. and International Equities trend-statuses at the start of each quarter – was Positive entering April, indicating positive prospects for equities in the second quarter.
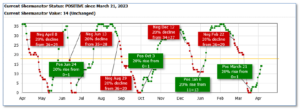
Next, the short-term(weeks to months) Indicator for US Equities turned positive on March 21, and ended the week at 14, up from the prior week’s 8.
In the Markets:
U.S. Markets: The major equity benchmarks finished predominantly to the downside during the holiday-shortened week. The Dow Jones Industrial Average rose 211 points to 33,485, a gain of 0.6%, while the technology-heavy NASDAQ Composite pulled back -1.1% to 12,088. By market cap, the large cap S&P 500 ticked down -0.1%, while the mid cap S&P 400 declined -2.6%. The small cap Russell 2000 fared the worst retreating -2.7%.
International Markets: International markets finished the week mixed. Canada’s TSX rose 0.5% and the United Kingdom’s FTSE 100 gained 1.4%. On Europe’s mainland, France’s CAC remained unchanged and Germany’s DAX ticked down -0.2%. In Asia, China’s Shanghai Composite rose 1.7%–its fourth consecutive week of gains. Japan’s Nikkei ended the week down -1.9%. As grouped by Morgan Stanley Capital International, emerging markets declined -0.2%. Developed markets rose 0.6%.
Commodities: Precious metals finished the week in the green. Gold added 2% closing at $2026.40 per ounce, while Silver rallied 3.9% to $25.09. The industrial metal copper, viewed by some analysts as a barometer of world economic health due to its wide variety of uses, finished the week down -1.9%. Oil closed up for a third consecutive week. West Texas Intermediate crude oil surged 6.7% to $80.70 per barrel.
U.S. Economic News: The number of Americans applying for jobless benefits topped over 200,000 for a ninth consecutive week and new data shows recent readings were worse than previously reported. The Labor Department reported initial jobless claims totaled 228,000 last week. Economists had estimated there would be just 200,000 new claims. Changes to the formula for ‘seasonal adjustments’ now show previous jobless claims numbers to be significantly higher than previously reported. The Bureau of Labor Statistics changed how it adjusts jobless claims for seasonal swings after the pandemic due to the large distortions it caused. Chief economist Eugenio Aleman at Raymond James wrote in a note, “The changes to the initial jobless claims’ seasonal factors changes the recent narrative and makes the case that the U.S. labor market has been weakening since the beginning of February of this year.” Meanwhile, the number of people already collecting unemployment benefits rose by 6,000 to 1.82 million. That number is reported with a one-week delay.
The U.S. added a respectable 236,000 new jobs in March, despite the Federal Reserve’s goal of a slowdown in hiring to tame inflation. While the increase was the smallest monthly rise in more than two years, the number of new jobs created remained higher than average. In addition, the unemployment rate dipped from 3.6% to 3.5%, another sign of strength in the labor market. In some positive news for the Fed, the increase in pay of the past year slowed again to a nearly two-year low of 4.2% from 4.6% and hourly wage growth slowed to a more mild 0.3% increase. The share of people working or looking for work, known as the labor-force participation rate, rose a tick to 62.6%. That reading was its highest since February 2020, the onset of the coronavirus pandemic.
Manufacturing activity pulled back for a fifth month in a row in March, according to the Institute for Supply Management. ISM reported its manufacturing survey dropped from 47.7 to 46.3 in the prior month. That reading is at its lowest level since May 2020—when the pandemic shut down much of the nation’s economy. Even worse, ISM’s report showed ‘new orders’ dropped 2.7 points to 44.3—a level historically associated with a recession. Manufacturers have battled supply shortages, high inflation, and rising interest rates over the past year. Deputy Chief U.S. Economist Andrew Hunter at Capital Economics noted, “The new orders index is very much in recessionary territory, with only one previous occasion over the past 60 years where the index has fallen to that level without an economic contraction following.” The Commerce Department also reported weakness in orders for manufactured goods. Orders fell 0.7% in February, their third decline in four months. That follows a 2.1% decline in January.
ISM also reported a slowdown in the vast services side of the U.S. economy. Services, which makes up more than 75% of GDP, fell 3.9 points to a three-month low of 52.1 last month. While numbers above 50 indicate companies are expanding, the latest survey suggests growth has taken a turn for the worse. In the details of the report, the new-orders index plunged 10.4 points to 52.2. That reading is its lowest since the end of last year. The employment barometer slipped by 2.7 points to 51.3. The prices-paid index, which measures inflation, declined 6.1 points to 59.5. “Prices are coming down but in small increments,” a transportation executive told ISM.
International Economic News: Canada’s job market surpassed expectations for March. Canada’s economy added 35,000 jobs last month, nearly three times more than economists expected. By province, Ontario, Alberta, Manitoba, and Prince Edward Island experienced the greatest increase in jobs. Saskatchewan lost 4,300 jobs and the other provinces saw little change. Despite the surge in hiring, the jobless rate inexorably held at 5% as people continued seeking out jobs too. Almost all of the new jobs were created in the private sector, while the self-employed and public sectors remained stagnant. The average hourly wage of a Canadian worker was $33.12 through March, a 5.3% increase from 2022. “A lot of employers say they’ve been having trouble finding workers, and what do you do? You bid up your offer and that tends to drive wages up,” said Pedro Antunes, chief economist with the Conference Board of Canada.
Across the Atlantic, Transport Minister Richard Holden sought to expand more job opportunities and stimulate economic growth between Scotland and the rest of the UK. Minister Holden met local businesses to explore how investment in road schemes, domestic flights, and railway lines between Scotland, Northern Ireland, and Wales could strengthen connectivity. Surveys found 60% of people thought improving transport links across the UK would positively impact their own nation. In meetings with community leaders, Minister Holden outlined the government’s commitment to developing new green technologies while supporting high-skilled jobs. The UK government, Scottish Government and North Lanarkshire Council, jointly invested £127 million into new transport links through Ravenscraig to improve connectivity between local towns and cities, creating more job opportunities. Minister Holden said, “Boosting transport connections across the UK will grow the economy and ensure that everyone no matter where they live has access to well-paid, high-quality jobs.”
French President Emmanuel Macron, European Commission President Ursula von der Leyen and over 50 French business leaders from varying industries arrived to sign agreements with China’s President Xi Jinping. In one deal signed with China, a new assembly line will be created in Tianjin for French aircraft manufacturer Airbus, which will double the company’s production capacity of A320 models. French energy company EDF renewed its 2007 agreement with the Chinese nuclear leader CGN, which allows the construction of new nuclear power plants. Von der Leyen told reporters in Beijing, “the EU is becoming more vigilant about protecting its interests and dependencies to ensure a level playing field.” She said the trade relationship between the EU and China is becoming increasingly imbalanced.
Despite an energy crisis and high inflation, Germany’s economic growth is forecasted around 0.3% this year and 1.5% in 2024, German Economy Minister Robert Habeck said. “Germany has mastered the extreme challenges: it has shown what it can do and what is possible when we act together and with determinism. We must also act with this determination in 2023.” Habeck was quick to take credit for the economy’s stabilization. However, leading research institutes in Germany slammed the government’s economic program. “The idea that we will get decarbonization and a growth miracle on top is an illusion,” said Stefan Kooths, Vice President of the Kiel Institute for the World Economy. “The growth prospects for the German economy are like a horse-drawn carriage in which the number of draught animals is decreasing, and the concentrated feed is being reduced, but more passengers are supposed to ride along,” Kooths added.
In Asia, analysts at Citi said China’s economic recovery is taking longer than expected prompting them to push back their forecasts for rebounds in their stock markets. “We expect [first-quarter 2023 corporate] results to be on the weaker side as post COVID recovery seems slower than expected,” the Citi report said. It said analysis of 2022 results of 316 Chinese companies found more misses than beats. Falling exports from slower growth in the U.S. and Europe is weighing on China’s economy, along with a slump in the massive real estate sector.
Japan’s economic output ran below full capacity for the 11th straight quarter in October-December, data from Japan’s central bank showed, suggesting that conditions for ending ultra-low interest rates have yet to fall into place. Japan’s output gap, which measures the difference between an economy’s actual and potential output, stood at -0.43% in the fourth quarter, widening from -0.08% in July-September. A negative output gap occurs when actual output is less than the economy’s full capacity and is considered a sign of weak demand that typically puts downward pressure on inflation. The output gap data is among factors the BOJ considers in gauging whether economic growth and domestic demand are strong enough for Japan to sustainably hit its 2% inflation target.
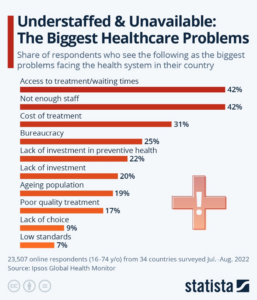
Finally: celebrated each year on April 7 to commemorate the founding of the World Health Organization, this year’s celebration is under the motto “Health for All”, as the WHO’s founding mission was to promote health and wellbeing globally. Of more than 23,000 respondents to the Ipsos 2022 Global Health Monitor survey, 42% named staffing shortages as the biggest problem facing the health care system in their country. In the United States, respondents said cost is the number one issue. The United States has the most expensive healthcare system in the world.
(Sources: All index- and returns-data from Yahoo Finance; news from Reuters, Barron’s, Wall St. Journal, Bloomberg.com, ft.com, guggenheimpartners.com, zerohedge.com, ritholtz.com, markit.com, financialpost.com, Eurostat, Statistics Canada, Yahoo! Finance, stocksandnews.com, marketwatch.com, wantchinatimes.com, BBC, 361capital.com, pensionpartners.com, cnbc.com, FactSet.) Content provided by WE Sherman and Company. Securities offered through Registered Representatives of Cambridge Investment Research Inc., a broker-dealer, member FINRA/SIPC. Advisory Services offered through Cambridge Investment Research Advisors, a Registered Investment Adviser. Strategic Investment Partners and Cambridge are not affiliated. Indices mentioned are unmanaged and cannot be invested into directly. Past performance is no guarantee of future results. These opinions of Strategic Investment Partners and not necessarily those of Cambridge Investment Research, are for informational purposes only and should not be construed or acted upon as individualized investment advice.