
3-9-20 Weekly Market Update
The very Big Picture:
The long-term valuation of the market is commonly measured by the Cyclically Adjusted Price to Earnings ratio, or “CAPE”, which smooths-out shorter-term earnings swings in order to get a longer-term assessment of market valuation. A CAPE level of 30 is considered to be the upper end of the normal range, and the level at which further PE-ratio expansion comes to a halt (meaning that further increases in market prices only occur as a general response to earnings increases, instead of rising “just because”). The market is currently at that level.
Of course, a “mania” could come along and drive prices higher – much higher, even – and for some years to come. Manias occur when valuation no longer seems to matter, and caution is thrown completely to the wind – as buyers rush in to buy first, and ask questions later. Two manias in the last century – the “Roaring Twenties” of the 1920s, and the “Tech Bubble” of the late 1990s – show that the sky is the limit when common sense is overcome by a blind desire to buy. But, of course, the piper must be paid, and the following decade or two were spent in Secular Bear Markets, giving most or all of the mania-gains back.
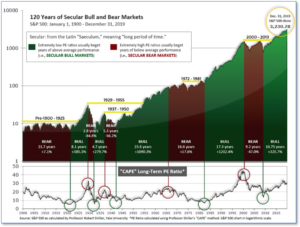
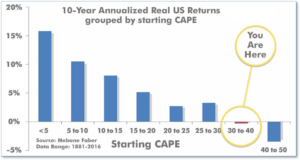
See Fig. 1 for the 100-year view of Secular Bulls and Bears. The CAPE is now at 28.22, down from the prior week’s 28.79, above the level reached at the pre-crash high in October, 2007. Since 1881, the average annual return for all ten-year periods that began with a CAPE around this level have been flat to slightly-negative (see Fig. 2).
Note: We do not use CAPE as an official input into our methods. However, if history is any guide – and history is typically ‘some’ kind of guide – it’s always good to simply know where we are on the historic continuum, where that may lead, and what sort of expectations one may wish to hold in order to craft an investment strategy that works in any market ‘season’ … whether current one, or one that may be ‘coming soon’!
The big Picture:
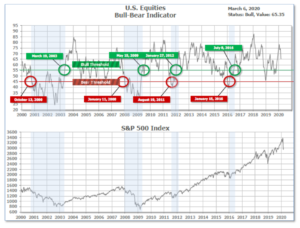
The “big picture” is the (typically) years-long timeframe – the timeframe in which Cyclical Bulls and Bears operate. The US Bull-Bear Indicator remains in Cyclical Bull territory at 65.35, down from the prior week’s 69.13.
In the Intermediate and Shorter-term Picture:
The Quarterly-Trend Indicator, based on the combination of US and International Equities trend-status at the start of each quarter was Positive entering January, indicating positive prospects for equities in the first quarter of 2020 as a whole. (On the “daily” version of the Quarterly-Trend Indicator, wer the intra-quarter status of the Indicator is subject to occasional change, both the US Equities and International Equity readings move to “Down” status).
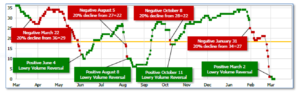
The Shorter-term (weeks to months) Indicator (see Fig. 4) is Negative. The indicator ended the week at 0, down from the prior week at 1.
The complete Picture:
Counting-up of the number of all our indicators that are ‘Up’ for U.S. Equities (see Fig. 3), the current tally is that three of four are Positive, representing a multitude of timeframes (two that can be solely days/weeks, or months+ at a time; another, a quarter at a time; and lastly, the {typically} years-long reading, that being the Cyclical Bull or Bear status).
In the Markets:
U.S. Markets: Volatile doesn’t even begin to describe the day-to-day swings of the major stock indexes last week. However, at the end of the day, the large cap benchmarks and the technology-heavy NASDAQ Composite recorded gains for the week, while the smaller-cap indexes ended the week modestly lower. The Dow Jones Industrial Average added 455 points last week ending the week at 25,864—a gain of 1.8%. The Nasdaq Composite finished up 0.1%, while the large cap S&P 500 added 0.6%. The mid cap S&P 400 index finished down -0.9%, followed by the small cap Russell 2000 which finished down -1.8%.
International Markets: International markets were red across the board, save one—China. Canada’s TSX declined ‑0.5%, while the United Kingdom’s FTSE retreated -1.8%. France’s CAC 40 fell -3.2% and Germany’s DAX finished down -2.9%. Italy, which has been particularly hard hit by the coronavirus outbreak, saw its Milan FTSE decline ‑5.4%. In Asia, China’s Shanghai Composite finished up a remarkable 5.4%, while Japan’s Nikkei ended down ‑1.9%. As grouped by Morgan Stanley Capital International, developed markets fell -0.8%, while emerging markets gave up -1.0%.
Commodities: Precious metals surged as investors headed for safe-haven assets. Gold gained over $105 to close at $1672.40 an ounce, an increase of 6.8%. Silver finished the week up 4.9% to $17.26 per ounce. Oil plunged for a second consecutive week, with West Texas Intermediate crude declining -7.8% to $41.28 per barrel. The industrial metal copper, viewed by some analysts as a barometer of world economic health due to its variety of uses, retraced some of last week’s decline by rising 0.8%.
U.S. Economic News: The number of Americans claiming first-time unemployment benefits dipped at the end of February, as jobless claims remained near a 50-year low. The Labor Department reported initial jobless claims slipped by 3,000 to 216,000 in the week ended February 29. Economists had expected a reading of 217,000. So far there’s little sign that the coronavirus epidemic has spurred companies to cut payrolls, but economists are watching closely to see if layoffs start to rise. The more stable monthly average of jobless claims, meanwhile, rose by 3,250 to 213,000. The four-week figure filters out the weekly ups and downs to give a better sense of labor-market trends. The total number of people already collecting unemployment benefits increased by 7,000 to 1.73 million. These claims had soared to as high as 6.6 million near the end of the 2007-2009 recession.
The monthly Non-Farm Payroll (NFP) report showed the U.S. economy created a surprisingly strong 273,000 new jobs in February—but the numbers were compiled shortly before the coronavirus contagion spread worldwide. Economists had forecast an increase of just 165,000. The unemployment rate ticked down to 3.5%–matching its lowest level in 50 years. The average wage paid to U.S. workers also improved, rising 9 cents, or 0.3%, to $28.52 an hour.
Manufacturers reported slowing business as supply bottlenecks tied to the coronavirus limited their ability to get needed parts, a survey of executives showed. The Institute for Supply Management (ISM) reported its manufacturing index declined 0.8% point to 50.1% in February. Economists had expected the index to total 50.5%. Readings over 50% indicate expansion, so the report stays – barely – in expansion territory. In the report, the ISM new-orders index slipped 2.2 points to 49.8% as new orders for manufactured goods fell into contraction. Production was barely positive. With the virus continuing to spread around the world, it’s more likely that conditions will worsen before they get better. Chris Williamson, chief business economist at IHS Markit stated, “Manufacturing production and order book trends deteriorated markedly in February as producers struggled against the double headwinds of falling export sales and supply chain delays.”
Conversely, the much larger services side of the economy expanded at its fastest pace in more than a year in February, but concerns over the coronavirus continued to grow. ISM reported its survey of service-oriented companies such as restaurants, hospitals, and recreation climbed 1.8 points to a robust 57.3. Economists had forecast a reading of 54.8. Service-oriented companies that derive most of their sales in the U.S. had been better shielded from the trade fight with China than American manufacturers, but the coronavirus is a different story. The viral outbreak has already hurt tourism, transportation and travel-related businesses and other sectors might soon feel the ill effects. While 16 of the 18 industries tracked by ISM said their businesses were expanding, that optimism appears to be fading. Anthony Nieves, chairman of the index committee stated, “Most respondents are concerned about the coronavirus and its supply chain impact.”
The Federal Reserve’s “Beige Book”, a collection of anecdotal information on current economic conditions from each of its member banks, showed that the coronavirus was starting to have an impact on the U.S. economy—especially the travel and tourism industries. The report also found worries among manufacturers that their supply chains would be disrupted in the coming weeks. However, even without the coronavirus, growth seemed to have slowed since the start of the year. While economic activity was seen as “modest to moderate” in the majority of Fed districts, two regional Fed districts — St. Louis and Kansas City— reported growth has fallen to a standstill. Worried about the impact of the coronavirus, the Fed cut its benchmark rate by a half-point on Tuesday to a range of 1%-1.25%. Jennifer Lee, senior economist at BMO Capital Markets stated, “It sounds like it might still be early days but certainly enough of the Fed’s business contacts were raising enough red flags to prompt action by the central bank.”
International Economic News: Canada’s central bank was leaning towards a rate cut even before the coronavirus outbreak pushed it to take action, Bank of Canada Governor Stephen Poloz said. The Bank of Canada lowered its target for the overnight rate by 50 basis points to 1.25% this week. Poloz said the bank wanted to cut rates “in a decisive manner” to have a cushion for Canada’s economy against the effects of the spread of coronavirus, similar to when oil prices collapsed about five years ago. In his statement he stated the downside risks to the economy today outweighed continuing concerns that cutting rates would fan financial vulnerabilities in Canada, such as high household debt. The cut was the bank’s first since 2015.
Across the Atlantic, the British government estimated a free trade deal with the United States could add $4.3 billion to the UK economy over the next 15 years. The UK government published its objectives for trade talks with the U.S. this week. Prime Minister Boris Johnson promised he would use the “best negotiators in the business” to hammer out a deal that boosts exports of UK products. Liz Truss, the UK International Trade Secretary, said in a statement, “Striking ambitious free trade agreements with our partners around the world is one of the key opportunities of Britain becoming an independent trading nation once again.”
On Europe’s mainland, a French economist warned the coronavirus will trigger a “very high” economic cost, as the deadly virus continues to spread across the globe. Economist Nicolas Bouzou said in an op-ed published in French newspaper Le Figaro “The economic cost of the coronavirus outbreak will be very high. There is no point in burying our heads in the sand: we are currently facing a major economic shock – one comparable in scale to the 2008 financial crisis.” Finance Minister Bruno Le Maire added that Europe had to be ready to use fiscal stimulus to deal with the impact of the epidemic on its fragile economy.
Europe’s economic powerhouse, Germany, saw its factory orders rebound just as disruptions from the coronavirus began to take hold. Germany had its biggest rise in industrial orders in more than five years in January. The increase was led by a sharp recovery in foreign demand, particularly from other Eurozone countries. Overall, German factory orders rose by a calendar-adjusted 5.5% from December to January. However, the good news was quickly tempered by fears of the spread of the coronavirus. Oliver Rakau chief German economist at Oxford economics stated, “This small good news is likely only a small interlude ahead of the corona disruptions looming in March/April.”
In Asia, the coronavirus outbreak has been particularly brutal for China. It is widely estimated that the outbreak could plunge the country’s economy into its first contraction since the 1970’s. This week revealed shockingly bad news for the services sector in the world’s second largest economy. Research firm Caixin reported its Purchasing Managers Index (PMI) for the sector plunged 25.3 points to 26.5—its lowest reading since the survey began in 2005. Readings below 50 indicate contraction rather than growth. Kit Juckes, a strategist at Societe Generale stated the obvious, “China’s economy is in a very bad way indeed.” China’s factories also recorded their worst month on record in February, according to government and Caixin data.
Bank of Japan Governor Haruhiko Kuroda pledged that the central bank would make every effort to ensure financial stability in financial markets roiled by the coronavirus outbreak. Issuing an emergency statement, Kuroda said the BOJ “will closely monitor future developments and will strive to provide ample liquidity and ensure stability in financial markets through appropriate market operations and asset purchases.” The move comes amid expectations that the world’s major central banks will prepare a joint assault on the recent volatility in financial markets. The BOJ quickly showed what kind of action it’s willing to take by offering to buy ¥500 billion ($4.6 billion) in government bonds with a repurchase agreement to provide liquidity to market participants.
Finally: The benchmark S&P 500 index recently plunged from record highs into correction territory (down more than 10%) faster than at any other time in history—just six days. So, are there now bargains to be found? Not yet, according to legendary investor Warren Buffet’s “Buffet Yardstick”. The Buffet Yardstick is a valuation measure that shows the market value of all publicly traded stocks as a percentage of the country’s gross national product. As it stood earlier this week, the numbers show that stocks are just as expensive as they were in 2000—right before a 50% drop, and they are 20% more expensive than they were ahead of the 57% plunge during the Financial Crisis. (Chart: thefelderreport.com)

Sources: All index- and returns-data from Yahoo Finance; news from Reuters, Barron’s, Wall St. Journal, Bloomberg.com, ft.com, guggenheimpartners.com, zerohedge.com, ritholtz.com, markit.com, financialpost.com, Eurostat, Statistics Canada, Yahoo! Finance, stocksandnews.com, marketwatch.com, wantchinatimes.com, BBC, 361capital.com, pensionpartners.com, cnbc.com, FactSet) Securities offered through Registered Representatives of Cambridge Investment Research Inc., a broker-dealer, member FINRA/SIPC. Advisory Services offered through Cambridge Investment Research Advisors, a Registered Investment Adviser. Strategic Investment Partners and Cambridge are not affiliated.
Indices mentioned are unmanaged and cannot be invested into directly. Past performance is no guarantee of future results. All Investing involves risk. Depending on the types of investments, there may be varying degrees of risk. Investors should be prepared to bear loss, including total loss of principal.