
2-6-2023 Weekly Market Update
The very Big Picture
The long-term valuation of the market is commonly measured by the Cyclically Adjusted Price to Earnings ratio, or “CAPE”, which smooths-out shorter-term earnings swings in order to get a longer-term assessment of market valuation. A CAPE level of 30 is considered to be the upper end of the normal range, and the level at which further PE-ratio expansion comes to a halt (meaning that further increases in market prices only occur as a general response to earnings increases, instead of rising “just because”). The market was recently above that level, and has fallen back.
Of course, a “mania” could come along and drive prices higher – much higher, even – and for some years to come. Manias occur when valuation no longer seems to matter, and caution is thrown completely to the wind – as buyers rush in to buy first, and ask questions later. Two manias in the last century – the “Roaring Twenties” of the 1920s, and the “Tech Bubble” of the late 1990s – show that the sky is the limit when common sense is overcome by a blind desire to buy. But, of course, the piper must be paid, and the following decade or two were spent in Secular Bear Markets, giving most or all of the mania-gains back.
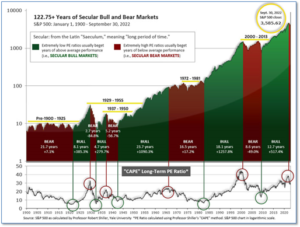
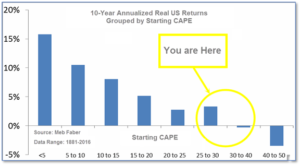
See Fig. 1 for the 100-year view of Secular Bulls and Bears. The CAPE is now at 30.04, up from the prior week’s 29.57. Since 1881, the average annual return for all ten-year periods that began with a CAPE in this range has been slightly positive to slightly negative (see Fig. 2).
Note: We do not use CAPE as an official input into our methods. However, if history is any guide – and history is typically ‘some’ kind of guide – it’s always good to simply know where we are on the historic continuum, where that may lead, and what sort of expectations one may wish to hold in order to craft an investment strategy that works in any market ‘season’ … whether the current one, or one that may be ‘coming soon’!
The Big Picture:
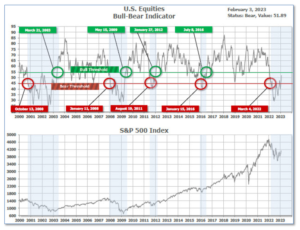
The ‘big picture’ is the (typically) years-long timeframe – the timeframe in which Cyclical Bulls and Bears operate. The U.S. Bull-Bear Indicator finished the week in Bear territory at 51.89, up from the prior week’s 48.94.
In the Quarterly- and Shorter-term Pictures
The Quarterly-Trend Indicator based on the combination of U.S. and International Equities trend-statuses at the start of each quarter – was Positive entering January, indicating positive prospects for equities in the first quarter of 2023.
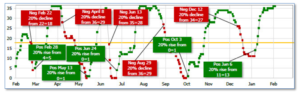
Next, the short-term(weeks to months) Indicator for US Equities turned positive on January 6, and ended the week at 36, up from the prior week’s 35.
In the Markets:
U.S. Markets: Most of the major U.S. stock market benchmarks extended their winning streaks into February, helped by some upside surprises in economic data and fourth-quarter earnings reports. The S&P 500 index reached an intraday high of 4,195 this week, its best level since late August. The narrowly-focused Dow Jones Industrial Average shed 52 points last week closing at 33,926—a decline of -0.2%. However, the technology-heavy NASDAQ Composite tacked on its fifth consecutive week of gains rising an additional 3.3%. By market cap, the large cap S&P 500 finished the week up 1.6%, while the mid-cap S&P 400 added 3.4% and the small cap Russell 2000 closed up 3.9%.
International Markets: International markets were mixed last week. Canada’s TSX ticked up 0.2%, while the UK’s FTSE 100 added 1.8%. France’s CAC 40 and Germany’s DAX rose 1.9% and 2.2% respectively. In Asia, China’s Shanghai Composite was essentially unchanged. Japan’s Nikkei closed up 0.5%. As grouped by Morgan Stanley Capital International, developed markets pulled back -0.3% and emerging markets fell -3.4%.
Commodities: Commodities finished the week mostly to the downside. Gold pulled back -2.7% to $1876.60 per ounce, while Silver retreated -5.2% to $22.41. West Texas Intermediate crude oil fell -7.9% to $73.39, back to near its starting point at the beginning of the year. The industrial metal copper, viewed by some analysts as a barometer of global economic health due to its wide variety of uses, finished down for a second week, giving up -3.9%.
January summary: All of the major U.S. indexes finished the month of January in the green. The Dow gained 2.8%, while the NASDAQ surged 10.7%. The S&P 500 added 6.2%, while mid caps and small caps rose 9.1% and 9.7% respectively. The month of January was very positive for international markets as well. Canada and the UK rose 7.1% and 4.3%, while France and Germany gained 9.4% and 8.7%. China’s Shanghai Composite added 5.4% and Japan rose 4.7%. Developed markets surged 9% and emerging markets jumped 9.1%. Precious metals ended the month of January mixed. Gold finished the month up 6.5%, but Silver ended down -0.8%. Oil ended down -1.7%, but Copper jumped 10.9%.
U.S. Economic News: The number of Americans filing claims for first-time unemployment dropped last week to a nine-month low, even as more firms announced layoffs. The Labor Department reported initial jobless claims fell by 3,000 to 183,000, signaling the U.S. labor market remains tight. Economists had forecast new claims would total 195,000. Twenty-seven of the 53 U.S. states and territories that report jobless claims showed an increase last week, most of them small. The rest reported declines. Meanwhile, the number of people already collecting benefits, known as ‘continuing claims’, fell by 11,000 to 1.66 million. That number is reported with a one-week delay.
The number of new jobs created in January rose by over 500,000 according to the latest data from the Bureau of Labor Statistics. The reading was much stronger than economists’ forecasts of 187,000 new jobs. However, some analysts were quick to point out that the government’s formula for seasonal swings in hiring sometimes exaggerates employment levels in January. It’s not clear yet whether that was the case last month. In addition, the government reported the unemployment rate slid to a 54-year low of 3.4% from 3.5%. That’s the lowest level since 1969. Hotels and restaurants (128,000 new positions) led the way, but hiring was also strong among health care providers and white-collar professional businesses. The only part of the economy to shed jobs was information services, a category that includes the media and some high-tech businesses.
The number of job openings rose to a five-month high of 11 million in December, a further sign that the labor market remains extremely tight despite a slowing economy and growing numbers of layoffs in the tech sector. In addition, almost 4.1 million people quit jobs in the final month of 2022, marking the 19th month in a row it’s topped the 4 million-mark. The biggest increase in demand for labor was at hotels and restaurants as they sought to keep up with the desire of Americans to dine out and travel. However, Julia Pollack, chief economist at ZipRecruiter contends the government report exaggerates the true demand for labor. “It is our belief that the current number of job openings … vastly overstates the current strength and tightness of the labor market,” she said.
Home prices fell for a fifth consecutive month in November, according to the latest data from Case-Shiller. S&P CoreLogic reported its Case-Shiller 20-city home price index fell a seasonally-adjusted 0.5% in its latest reading. Home prices were still up 8.6% year-over-year, but down from 10.4% in October. A broader measure of home prices, the national index, fell by a seasonally-adjusted 0.6%. Miami, Tampa, and Atlanta reported the largest annual home price gains among the 20 major cities. Still, there is some optimism that home prices may be bottoming. Mortgage rates have backed off about 100 basis points since their October highs. Doug Duncan, chief economist at Fannie Mae stated that he expects housing to help keep the economy from a severe downturn.
The Federal Reserve hiked interest rates again this week, but foresees only a “couple more hikes” in its battle with inflation. The Federal Reserve approved a 0.25 percentage-point increase in key U.S. interest rates lifting its short-term benchmark rate to a range of 4.5-4.75%. The decision followed six larger consecutive rate hikes as the Fed stepped up its efforts to reign in the worst bout of inflation in 40 years. Fed Chairman Jerome Powell said a “disinflationary” process is under way at a press conference after the decision. Yet he also reiterated the Fed needs to see “substantially more evidence” that price pressures are evaporating. The central bank did alter some parts of its statement to indicate it would raise rates in smaller increments. In December, the bank’s interest-rate-setting panel forecast that its benchmark rate would top out at around 5% to 5.25%. That suggests two more rate hikes of a quarter point, as alluded to by Powell. “The [Fed] has moved past stage one, debating how fast to raise rates, to stage two, debating how far to raise rates,” said chief economist Chris Low of FHN Financial. “Stage three will be debating how long to keep rates at their peak.”
Confidence among the nation’s consumers slipped at the start of the year as worries over an impending recession continued to grow. The Conference Board reported its index of consumer confidence slipped almost 2 points to 107.1 in January. Economists had expected the index to rise to 109.5. While the index had hit an 11-month high at the end of 2022, it is well below the levels associated with a healthy economy. In the report, the measure of how consumers feel about the economy right now rose to 150.9 in January, from 147.4 in December, while the similar gauge that looks ahead six months dropped 5.6 points to 77.8. Notably, a reading below 80 often signals a recession within the next year, the board said, but the expectations index has hovered below that level in every month except for one since March 2022. Ben Ayers, senior economist at Nationwide stated the survey reflects, “waning confidence in the state of the economy in 2023. We project that a moderate recession will take hold by mid-year.”
A key barometer of factory activity contracted for a third consecutive month. The Institute for Supply Management (ISM) reported its manufacturing survey fell 1 point to 47.4 and touched the lowest level since the pandemic. Economists had expected the index to come in at 48. “We knew the first half [of 2023] was going to be a little bit of a struggle,” said Timothy Fiore, chairman of the survey. The last time the index was that low was in May 2020 during the early stages of the pandemic. In the report, the index of new orders dropped 2.6 points to 42.5 (of note, that sub-index has never been that low except during previous recessions). The employment gauge slipped 0.2 points to but remained positive at 50.6. Companies remain hesitant to let workers go given the difficulty finding quality replacements amid the worst labor shortage in decades. Following the release, Andrew Hunter, senior U.S. economist at Capital Economics stated, “The ISM report reinforces our view that the U.S. economy is heading for recession. The silver lining is that weakening demand is continuing to exert downward pressure on inflation.”
International Economic News: Canada’s Deputy Prime Minister and Finance Minister Chrystia Freeland said the two major spending pressures on the federal government are health care and the global transition to a clean economy. After meeting with the provincial and territorial finance ministers, Freeland said Biden’s Inflation Reduction Act, which includes electric vehicle incentives for manufacturers in Canada and Mexico, has changed the playing field for global competition for capital. Freeland said that Canada needs to invest in the transition or risk being left behind. “I cannot emphasize too strongly how much I believe that we need to seize the moment and build the clean economy of the 21st century,” Freeland said.
Across the Atlantic, the Bank of England raised interest rates by 50 basis points and dialed back the severity of its recession forecast. The Monetary Policy Committee (MPC) voted for its second consecutive half-point rate hike, which brought the main Bank rate to 4%. In its decision statement, smaller hikes and a cessation to the hiking cycle may be addressed in future meetings. “Annual CPI inflation is expected to fall to around 4% towards the end of this year, alongside a much shallower projected decline in output than in the November Report forecast,” the Bank stated. The Bank is expecting the economy to contract throughout 2023, as energy prices remain high, and rising market interest rates restrict spending. However, the forecast from last November, for a four-quarter GDP decrease of 2%, has been revised down to just 0.7%. Hussain Mehdi, macro and investment strategist at HSBC Global Asset Management, said “The big question is now the speed in which the MPC can reverse course on rates. A downside risk for markets and the economy is a long period of restrictive policy to deal with persistent underlying inflation,” he said.
On Europe’s mainland, the French economy managed a slight expansion in the fourth quarter, as government policies cushioned households and businesses from high energy prices. The economy grew by a marginal 0.1% according to preliminary data from the country’s statistics office, Insee. Household consumption declined by 0.9% on quarter, suggesting inflation took its toll on spending, Insee said. Business investment slowed sharply but contributed positively to growth, as it did foreign trade. France’s economy expanded by 2.6% in 2022 as a whole, helped by resilient demand and the rebound in the services sector.
Germany’s economy unexpectedly shrank in the fourth quarter, a sign that Europe’s largest economy may be entering a recession. Germany’s Federal Statistics Office, Destatis, reported GDP decreased 0.2% quarter-on-quarter. Economists had expected a flat reading. VP Bank chief economist Thomas Gitzel stated, “The winter months are turning out to be difficult – although not quite as difficult as originally expected.” Still, Gitzel notes that while signs of a severe recession of the German economy remains absent, “a slight recession is still on the cards.” The government has said the economic situation should improve from spring onwards, and last week revised its GDP forecast upward for 2023 — predicting growth of 0.2%, up from an autumn forecast of a 0.4% decline.
In Asia, the International Monetary Fund (IMF) expects China’s economy to rebound this year as mobility and activity pick up after the lifting of pandemic restrictions. According to its latest projections, China’s economy is set to expand 5.2% this year, versus 3% last year. That’s good news for the global economy as China’s economy is now expected to contribute a quarter of total global growth this year. Still, China faces significant headwinds—a contraction in real estate, a shrinking population, and slowing productivity growth. According to the IMF, China’s economy needs comprehensive macroeconomic policies and structural reforms to secure the recovery and “promote balanced, green, and inclusive growth.”
The average Japanese worker hasn’t had a raise in 30 years as the country has suffered from a prolonged period of deflation. However, that situation has changed as inflation has now become a major issue in the world’s third-largest economy. Inflation in Japan hit a 41-year high of 4.0% in December. While low compared to rest of the developed world, the Japanese are more used to prices going down rather than up. “In a country where you haven’t had nominal wage growth over 30 years, real wages are declining quite rapidly as a result [of inflation],” said Stefan Angrick, a Tokyo-based senior economist at Moody’s Analytics. Last month, Japan recorded its biggest drop in earnings, once inflation is taken into account, in nearly a decade.
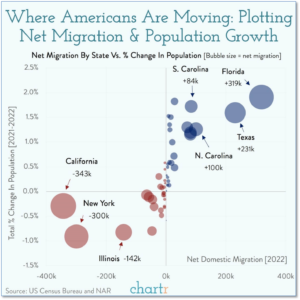
Finally: New data from the Census Bureau and the National Association of Realtors reveal which states have been the biggest winners (and which the biggest losers) as the nation’s population continues to shift. Florida topped the 2022 net migration chart with an influx of over 300,000 people choosing to call the Sunshine State their new home. Florida was followed by large increases in Texas (up 231,000) and South Carolina (up 84,000). The biggest losers were the states of California (-343,000), New York (-300,000), and Illinois (-142,000). Chart on next page. (Chart from chartr.co)
(Sources: All index- and returns-data from Yahoo Finance; news from Reuters, Barron’s, Wall St. Journal, Bloomberg.com, ft.com, guggenheimpartners.com, zerohedge.com, ritholtz.com, markit.com, financialpost.com, Eurostat, Statistics Canada, Yahoo! Finance, stocksandnews.com, marketwatch.com, wantchinatimes.com, BBC, 361capital.com, pensionpartners.com, cnbc.com, FactSet.) Content provided by WE Sherman and Company. Securities offered through Registered Representatives of Cambridge Investment Research Inc., a broker-dealer, member FINRA/SIPC. Advisory Services offered through Cambridge Investment Research Advisors, a Registered Investment Adviser. Strategic Investment Partners and Cambridge are not affiliated. Indices mentioned are unmanaged and cannot be invested into directly. Past performance is no guarantee of future results. These opinions of Strategic Investment Partners and not necessarily those of Cambridge Investment Research, are for informational purposes only and should not be construed or acted upon as individualized investment advice.