
1-30-2023 Weekly Market Update
The very Big Picture
The long-term valuation of the market is commonly measured by the Cyclically Adjusted Price to Earnings ratio, or “CAPE”, which smooths-out shorter-term earnings swings in order to get a longer-term assessment of market valuation. A CAPE level of 30 is considered to be the upper end of the normal range, and the level at which further PE-ratio expansion comes to a halt (meaning that further increases in market prices only occur as a general response to earnings increases, instead of rising “just because”). The market was recently above that level, and has fallen back.
Of course, a “mania” could come along and drive prices higher – much higher, even – and for some years to come. Manias occur when valuation no longer seems to matter, and caution is thrown completely to the wind – as buyers rush in to buy first, and ask questions later. Two manias in the last century – the “Roaring Twenties” of the 1920s, and the “Tech Bubble” of the late 1990s – show that the sky is the limit when common sense is overcome by a blind desire to buy. But, of course, the piper must be paid, and the following decade or two were spent in Secular Bear Markets, giving most or all of the mania-gains back.
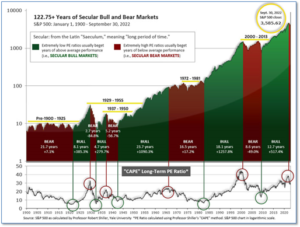
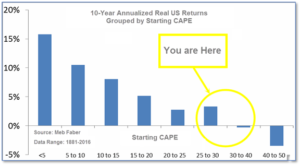
See Fig. 1 for the 100-year view of Secular Bulls and Bears. The CAPE is now at 29.57, up from the prior week’s 29.05. Since 1881, the average annual return for all ten-year periods that began with a CAPE in this range has been slightly positive to slightly negative (see Fig. 2).
Note: We do not use CAPE as an official input into our methods. However, if history is any guide – and history is typically ‘some’ kind of guide – it’s always good to simply know where we are on the historic continuum, where that may lead, and what sort of expectations one may wish to hold in order to craft an investment strategy that works in any market ‘season’ … whether the current one, or one that may be ‘coming soon’!
The Big Picture:
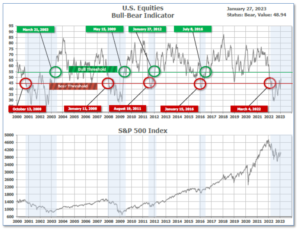
The ‘big picture’ is the (typically) years-long timeframe – the timeframe in which Cyclical Bulls and Bears operate. The U.S. Bull-Bear Indicator finished the week in Bear territory at 48.94, up from the prior week’s 46.19.
In the Quarterly- and Shorter-term Pictures
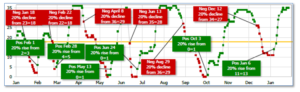
The Quarterly-Trend Indicator based on the combination of U.S. and International Equities trend-statuses at the start of each quarter – was Positive entering January, indicating positive prospects for equities in the first quarter of 2023.
Next, the short-term(weeks to months) Indicator for US Equities turned positive on January 6, and ended the week at 35, up from the prior week’s 34.
In the Markets:
U.S. Markets: U.S. stocks resumed their winning streak, as investors appeared to welcome economic data that supported hopes of a “soft landing”. The Dow Jones Industrial Average rose over 600 points finishing the week at 33,978, a gain of 1.8%. The technology-heavy NASDAQ composite notched its fourth consecutive week of gains, rising 4.3% to 11,622. By market cap, the large cap S&P 500 rose 2.5%, while the mid cap S&P 400 and small cap Russell 2000 each added 2.4%.
International Markets: International markets finished the week predominantly to the upside as well. Canada’s TSX added 1%, while the United Kingdom’s FTSE 100 ticked down a modest -0.1%. On Europe’s mainland, France’s CAC 40 and Germany’s DAX added 0.4% and 0.8%, respectively. In Asia, China’s Shanghai Composite rose 2.2%. Japan’s Nikkei gained 3.1%. As grouped by Morgan Stanley Capital International, developed markets finished the week up 0.8% and emerging markets rose 1.4%.
Commodities: Precious metals finished the week mixed. Gold finished up $1.20 to $1929.40 per ounce, while Silver pulled back -1.3% to $23.62. The industrial metal copper, viewed by some analysts as a barometer of world economic health due to its wide variety of uses, finished the week down -0.7%. West Texas intermediate crude oil retraced last week’s move pulling back -2.4% to $79.68 per barrel.
U.S. Economic News: The number of Americans filing for first-time unemployment benefits fell to their lowest level since last April, as the number of claims came in well below expectations. The Labor Department reported initial jobless claims rose by 6,000 to 186,000 last week. Economists had expected claims to rise by 15,000 to 205,000. Meanwhile, the number of people already receiving benefits, known as ‘continuing-claims’ rose by 20,000 to 1.68 million. Sal Guatieri, senior economist at BMO Capital Markets, says companies are holding onto workers because they believe any recession is going to be shallow.
Following a six-month losing streak, the housing market may be approaching a bottom. The National Association of Realtors (NAR) reported its Pending Home Sales index, transactions in which a contract has been signed but not yet closed, rose 2.5% in December, reversing a string of declines. Analysts had expected pending home sales to drop by 1%. Coincident with the improvement in pending home sales, mortgage application activity also rose in the latest week. Compared with the same time last year, transactions were still down 33.8%. By region, pending sales rose in the South and the West, but dropped in the Northeast and Midwest. “This recent low point in home sales activity is likely over,” NAR Chief Economist Lawrence Yun said. “Mortgage rates are the dominant factor driving home sales, and recent declines in rates are clearly helping to stabilize the market.” Yun expects mortgage rates to hover between the 5.5% and 6.5% range.
The U.S. economy got off to a weak start in the new year according to a pair of surveys from Standard & Poor’s. Business conditions contracted again in January as demand for goods and services fell for the fourth month in a row, however there are signs of improvement. S&P reported its preliminary, or “flash”, index of the services sector rose 2.1 points to a three-month high of 46.6 in January. While an improvement, readings below 50 still indicate contraction. With regards to manufacturing, S&P reported its manufacturing sector index edged up to 46.7 from a year-and-a-half low of 46.2 last month. The S&P surveys are among the first indicators in each month to assess the health of the economy. “The U.S. economy has started 2023 on a disappointingly soft note,” said Chris Williamson, chief business economist at S&P Global. “Companies cite concerns over the ongoing impact of high prices and rising interest rates, as well as lingering worries over supply and labor shortages.”
Orders for goods expected to last at least three years, so-called ‘durable goods’, jumped 5.6% in December, but the report wasn’t as impressive as the headline number suggests. The vast majority of the improvement was due to a large number of new contracts for Boeing passenger planes. If transportation is set aside, new orders actually fell 0.1% last month. Furthermore, a key measure of business investment also declined for the second time in four months. Demand for new cars and trucks rose less than 1%. Bookings fell in most other major categories as well. Economists had forecast a 2.4% increase in orders for durable goods.
The rate of inflation slowed again to just a 0.1% month-over-month rise in December, another sign inflation is cooling off, according to the Federal Reserve’s “preferred” measure of inflation. The Personal Consumption Expenditures index, or PCE, has tapered off rapidly since last summer. Falling oil prices have played a large role, but inflation more broadly is easing as well. The annual increase in prices slowed to 5% in December from 5.5% in the prior month. The reading is the smallest increase in 15 months, though well above the pre-pandemic levels of less than 2% inflation. The more closely followed core index, which strips out volatile food and energy costs, rose a modest 0.3%, matching forecasts. The increase in the core rate of inflation in the past 12 months decelerated to 4.4% from 4.7%. That’s also the lowest level in 14 months. Chief North American economist Paul Ashworth of Capital Economics expects the cooling inflation will give the Federal Reserve room to begin cutting interest rates. Ashworth wrote in a note to clients, “With higher interest rates evidently weighing heavily on demand now, we expect core inflation to continue moderating. That will eventually persuade the Fed to begin cutting interest rates late this year.”
The U.S. economy grew at a robust 2.9% annual pace in the final quarter of last year, according to the first report of fourth quarter GDP. However, economists aren’t expecting the strength to continue as rising interest rates weigh on growth and threaten to incite a recession. Consumer spending, the main engine of the economy, increased at a solid 2.1% annual clip in the four quarter, the government said. That’s down a bit from a 2.3% pace in the prior quarter. The resilience of consumer spending was one of the big bright spots in the GDP report. Household outlays account for 70% of all U.S. economic activity. Inflation rose at an annual 3.2% pace in the fourth quarter, compared to a 4.3% advance in the prior three-month period. Following the release, senior economist Sal Guatieri of BMO Capital Markets stated, “The U.S. economy isn’t falling off a cliff, but it is losing stamina and risks contracting early this year.”
Sentiment among the nation’s consumers improved this month, according to the University of Michigan’s survey of consumer attitudes. U of M’s reported its gauge of consumer attitudes rose 5.2 points to 64.9 this month. Economists had expected a reading of 64.6. The measure of how consumers feel about current conditions rose to 9 points to 68.4, while the index that measures expectations for the next six months rose 2.8 points to 62.7. Americans viewed that inflation was moderating in January. They expected the inflation rate in the next year to average about 3.9%, down from 4.4% in December. This is the lowest level since April 2021. Despite the improvement, sentiment remains well below its pre-pandemic level of 101 hit in February of 2020.
International Economic News: The Bank of Canada raised interest rates this week by a quarter point and said it would now pause and assess the economic impacts of raising interest rates to bring down inflation. The BoC increased its target for the overnight rate to 4.5% from 4.25%–the highest level in 15 years. The Bank of Canada is one of the first central banks among major economies to declare that it is done for now raising interest rates. In the latest quarterly survey released by the central bank, Canada’s consumer-price index declined from June’s 8.1% peak to December’s 6.3% and mortgage interest payments have climbed to 4.5% in 2023, from 3.2% last year. The central bank justified the latest rate increase by pointing to recent growth data showing more strength than anticipated. Businesses still report having difficulty finding qualified workers and the unemployment rate remains near historic lows. At a press conference in the Canadian capital, the Bank of Canada Governor Tiff Macklem stated, “We have raised rates rapidly, and now it’s time to pause and assess whether monetary policy is sufficiently restrictive to bring inflation back to the 2% [inflation] target.”
Across the Atlantic, British Finance Minister Jeremy Hunt signaled he is pushing ahead with tax hikes and post-Brexit reforms. This week, Hunt addressed tech giants, including Google, Meta, and Amazon, in a speech asking for their assistance in making the U.K. into “the world’s next Silicon Valley.” Hunt told the companies that they were important for the U.K.’s economic outlook, but that Britain is important for their future as well. Susannah Streeter, Senior Investment and Markets analyst at Hargreaves Lansdown wrote in a note to clients, “Hunt’s latest comments were more about improving the image of Britain’s economic circumstances than about supplying new policies.”
On Europe’s mainland, the number of people unemployed in France reached its lowest level since 2011. Furthermore, France’s Labor Ministry reported the number of job seekers decreased by 9.3% over the past year. However, the French Central Bank warned that the unemployment rate may increase through 2023. In its projections for this year, the French Central Bank forecasts lagging economic growth could raise the unemployment rate to 7.5% this year and 8.2% in 2024. The overall Eurozone unemployment rate stood at 6.5% in the fourth quarter of 2022. French President Emmanuel Macron has set a target of 5% unemployment by the end of his term in 2027.
The German government said it expects to maintain economic growth this year instead of a decline as it works to break its energy dependence on Russia. Germany’s outlook for 2023 improved to a 0.2% expansion from a 0.4% contraction that was expected in October, when Germany feared it would run out of natural gas used to power factories, generate electricity, and heat homes this winter. Warmer-than-usual weather and a scramble to line up additional supplies of liquefied natural gas, or LNG, that comes by ship instead of pipeline from Russia was responsible for the improvement. Germany went from having zero floating LNG terminals to now having three on its northern coast, at a cost of billions of euros. “We have made the crisis manageable,” Vice Chancellor and Economy Minister Robert Habeck said.
In Asia, after nearly three years of strict coronavirus control, China’s swift reopening could stoke global inflation just as it has shown signs of abating analysts say. Since the beginning of January, prices for copper, aluminum and zinc have all had their best start to a year in 11 years, rallying by an average of 13%, according to analysts at Deutsche Bank. Tin, which is largely used to make electronics, has soared 30%, its biggest rise in 32 years. Nicky Shiels, head of metals strategy at precious metals trader MKS Pamp stated, “There’s a tremendous amount of pent-up demand that we do expect to come back to markets, specifically after Chinese New Year.” It’s not just commodities that are rising on hopes for China’s recovery. Stocks in MSCI’s China index have risen 14% since the start of trading this year.
Core consumer prices in Japan’s capital Tokyo, a leading indicator of nationwide trends, rose 4.3% in January from a year earlier marking its fastest annual gain in nearly 42 years. The data heightens the chance that inflation will stay well above the Bank of Japan’s 2% target in coming months as companies continue to steadily pass on higher costs to households. The reading exceeded the median market forecast of a 4.2% gain. The yen and the yield on the 10‑year Japanese government bond (JGB) rose after the data release, reflecting market expectations that rising inflation could prod the BOJ to soon dial back stimulus.
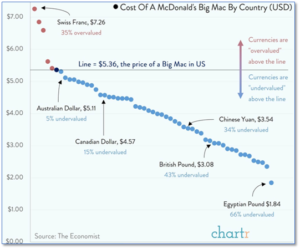
Finally: As an illustration of “purchasing power parity”, the ‘Economist’ once again released the latest reading for their “Big Mac Index”—which shows the cost of a McDonald’s Big Mac by Country all over the world. While professional economists may balk at the overly simplistic model as it doesn’t take into account all of the input costs of making a Big Mac–property and labor for example–the index serves as a quick “off the cuff” means to measure relative exchange rates across a variety of world currencies. According to its latest reading, arbitrageurs could make a respectable profit by loading up on Big Macs in Egypt—and then selling them in Switzerland. (Chart from chartr.co)
(Sources: All index- and returns-data from Yahoo Finance; news from Reuters, Barron’s, Wall St. Journal, Bloomberg.com, ft.com, guggenheimpartners.com, zerohedge.com, ritholtz.com, markit.com, financialpost.com, Eurostat, Statistics Canada, Yahoo! Finance, stocksandnews.com, marketwatch.com, wantchinatimes.com, BBC, 361capital.com, pensionpartners.com, cnbc.com, FactSet.) Content provided by WE Sherman and Company. Securities offered through Registered Representatives of Cambridge Investment Research Inc., a broker-dealer, member FINRA/SIPC. Advisory Services offered through Cambridge Investment Research Advisors, a Registered Investment Adviser. Strategic Investment Partners and Cambridge are not affiliated. Indices mentioned are unmanaged and cannot be invested into directly. Past performance is no guarantee of future results. These opinions of Strategic Investment Partners and not necessarily those of Cambridge Investment Research, are for informational purposes only and should not be construed or acted upon as individualized investment advice.