
11-8-2021 Weekly Market Update
The very Big Picture
The long-term valuation of the market is commonly measured by the Cyclically Adjusted Price to Earnings ratio, or “CAPE”, which smooths-out shorter-term earnings swings in order to get a longer-term assessment of market valuation. A CAPE level of 30 is considered to be the upper end of the normal range, and the level at which further PE-ratio expansion comes to a halt (meaning that further increases in market prices only occur as a general response to earnings increases, instead of rising “just because”). The market is now above at that level.
Of course, a “mania” could come along and drive prices higher – much higher, even – and for some years to come. Manias occur when valuation no longer seems to matter, and caution is thrown completely to the wind – as buyers rush in to buy first, and ask questions later. Two manias in the last century – the “Roaring Twenties” of the 1920s, and the “Tech Bubble” of the late 1990s – show that the sky is the limit when common sense is overcome by a blind desire to buy. But, of course, the piper must be paid, and the following decade or two were spent in Secular Bear Markets, giving most or all of the mania-gains back.
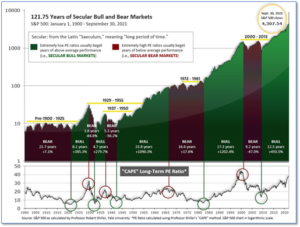
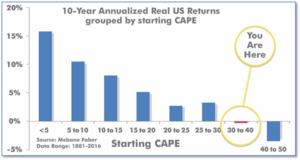
See Fig. 1 for the 100-year view of Secular Bulls and Bears. The CAPE is now at 40.00, up from the prior week’s 39.22. Since 1881, the average annual return for all ten-year periods that began with a CAPE in the 40+ range has been negative (see Fig. 2).
Note: We do not use CAPE as an official input into our methods. However, if history is any guide – and history is typically ‘some’ kind of guide – it’s always good to simply know where we are on the historic continuum, where that may lead, and what sort of expectations one may wish to hold in order to craft an investment strategy that works in any market ‘season’ … whether the current one, or one that may be ‘coming soon’!
The Big Picture:
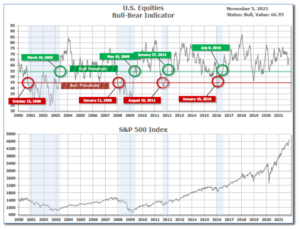
The ‘big picture’ is the (typically) years-long timeframe – the timeframe in which Cyclical Bulls and Bears operate. The U.S. Bull-Bear Indicator is in Cyclical Bull territory at 66.95, up from the prior week’s 64.86.
In the Quarterly- and Shorter-term Pictures
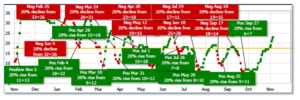
The Quarterly-Trend Indicator based on the combination of U.S. and International Equities trend-statuses at the start of each quarter – was Positive entering October, indicating positive prospects for equities in the fourth quarter of 2021.
Next, the short-term(weeks to months) Indicator for US Equities turned positive on September 27 and ended the week at 23, up from the prior week’s 17.
In the Markets:
U.S. Markets: U.S. stocks posted impressive gains for the week following healthy economic data, strong earnings reports, and a relatively dovish Federal Reserve policy meeting. The Dow Jones Industrial Average, benchmark S&P 500 index, and the technology-heavy NASDAQ Composite all reached record highs. The Dow cleared the 36,000 milestone with a 508 point gain to 36,328—an increase of 1.4%. The NASDAQ rose for a fifth consecutive week closing at 15,972, a gain of 3.1%. By market cap, the large cap S&P 500 finished up 2.0%, while the mid cap S&P 400 and small cap Russell 2000 finished the week strongly, up 4.0% and 6.1% respectively.
International Markets: Major international markets finished the week predominantly in the green. Canada’s TSX rose 2.0% and the United Kingdom’s FTSE 100 gained 0.9%. On Europe’s mainland, France’s CAC 40 and Germany’s DAX finished up 3.1% and 2.3%, respectively. In Asia, China’s Shanghai Composite declined -1.6% while Japan’s Nikkei added 2.5%. As grouped by Morgan Stanley Capital International, developed markets rose 1.7%, while emerging markets finished the week unchanged.
Commodities: Precious metals finished the week solidly to the upside. Gold rose $32.90 to $1816.80 per ounce, a gain of 1.8%. Silver added 0.9% closing at $24.16 per ounce. Oil closed down for a second week, declining -2.8% to $81.27 per barrel of West Texas Intermediate crude. The industrial metal copper, viewed by some analysts as a barometer or world economic health due to its wide variety of uses, finished the week down -0.6%.
U.S. Economic News: The number of Americans filing first-time unemployment claims hit a new pandemic low as firms continued to retain the workers they already have (and continued to search for new ones). The Labor Department reported new jobless claims dropped by 14,000 to 269,000 last week. Economists had expected claims to total 275,000. Last month new unemployment filings dropped below the key 300,000 level for the first time since the start of the viral outbreak in March 2020. New jobless claims declined the most last week in Florida and Missouri. The only states to post sizable increases were Kentucky and California. Continuing claims, which counts the number of people already receiving benefits, fell by 134,000 to 2.1 million. That number is at a pandemic low.
The U.S. job market snapped back in October as the number of new jobs created smashed economists’ expectations. The Labor Department reported nonfarm payrolls rose by 531,000 bringing the unemployment rate down to 4.6%. Economists had expected just 450,000 new jobs would be created. Private payrolls were even stronger, rising by 604,000. A loss of 73,000 government jobs pulled down the headline number (the “loss” was actually a seasonal adjustment and not a true loss of jobs). October’s gains were a sharp pickup from September’s 312,000 new jobs created. Given the solid report, analysts were optimistic about the future. Nick Bunker, economic research director at job placement site Indeed stated, “If this is the sort of job growth we will see in the next several months, we are on a solid path.” The critical leisure and hospitality sector led the way with 164,000 new jobs, followed by professional and business service (100,000), and manufacturing (60,000). The labor force participation rate held steady at 61.6%. That number remains 1.7 points below its February 2020 level indicating roughly 3 million fewer Americans are currently in the workforce.
Manufacturing activity in the United States remained robust in October despite numerous hurdles, a closely-watched survey found. The Institute for Supply Management (ISM) reported its index for manufacturers ticked lower last month to 60.8 from 61.1 in the prior month. However, analysts still viewed this as a positive report. Readings over 50 signify growth and any readings over 60 are considered exceptional. Furthermore, the reading exceeded economists’ expectations of 60.3. The index has been above its growth threshold for 17 consecutive months. In the details, there was a notable drop in the new orders index to 59.8 and production ticked down 0.1 point to 59.3. Manufacturers continue to struggle with a trifecta of shortages of supplies, labor, and now shipping difficulties. Despite these constraints, the sector continues to grow and sentiment in the industry remains strong.
In the vastly larger services side of the economy, the Institute for Supply Management (ISM) reported its sentiment index for that sector soared in October. ISM reported its services index jumped to a record 66.7 last month—up 4.8 points from September. The increase was much bigger than Wall Street expected. Economists had forecast ISM’s services index to come in at 62. Analysts believe a fall in the number of coronavirus cases gave Americans the confidence to go outside again and spend more freely at restaurants, hotels, and other service-related businesses. The biggest worry among executives remains the shortages of both workers and supplies. New orders and production both rose to record highs in all 18 industries tracked by ISM. “Demand is red-hot,” said senior U.S. economist Andrew Hunter of Capital Economics, but “supply is still struggling to keep up.”
In a key announcement this week, the Federal Reserve announced it will begin to wind-down its bond-buying program designed to prop-up the economy during the darkest days of the pandemic. The Fed started buying trillions of dollars of bonds when the pandemic struck in early 2020, eventually slowing the pace to $120 billion per month. The central bank’s balance sheet has topped $8 trillion. Last December, the Fed had stated it would continue to buy bonds until the economy made “substantial” progress towards its goal of 2% inflation and a healthy labor market. This week, the Fed said it would reduce the pace of purchases to just $15 billion per month for November and December and added that “similar reductions in the pace of net asset purchases will likely be appropriate each month.” Still, the Fed stressed it was keeping all options on the table writing the FOMC “is prepared to adjust the pace of purchases if warranted by changes in the economic outlook.” If the Fed proceeds at the pace set out, it will complete the bond-buying program in the middle of 2022. In its policy statement, the Fed switched the language to say that inflation was elevated due to factors “that are expected” to be transitory.
International Economic News: Canada’s banks have gotten the green light to resume share buybacks and increase their dividends after regulators removed restrictions put in place to protect the financial system during panic. Canada’s Office of the Superintendent of Financial Institutions (OSFI) said in addition to the above, banks may also increase executive compensation. Peter Routledge, head of the OSFI said he did not believe that lifting the restrictions “will detract from financial institutions’ ability to support the economic recovery or from public confidence in the Canadian financial system.” The decision was made after banks began to release provisions for loan losses in recent quarters and Canadians returned to making mortgage payments after their six-month deferrals ended without a wave of defaults, Routledge said.
Across the Atlantic, business activity in the United Kingdom hit a three-month high in October exceeding expectations and indicating the economy remains on an upward trajectory. Research firm IHS/Markit reported its composite Purchasing Managers’ Index (PMI) was 57.8 in October, up from 54.9 in September and above the earlier “flash” reading of 56.8. The reading indicates the UK’s post-lockdown recovery remains robust. October’s increase was driven by services, where reported activity rose to 59.1—the highest reading since July. Duncan Brock, group director at the Chartered Institute of Procurement and Supply, said the rise was driven by domestic markets but also export orders increased to the highest level since 2018 as travel opportunities reopened.
On Europe’s mainland, French President Emmanuel Macron said he was postponing planned trade sanctions on Britain so that negotiators from both sides could work on new proposals to settle their dispute over post-Brexit fishing rights. Earlier, France had said it would restrict cross-Channel trade threatening to turn a disagreement over fishing into a wider trade dispute between two of Europe’s biggest economies. The measures threatened by France include increased border and sanitary checks on goods from Britain and banning British vessels from some French ports, steps that have the potential to bring cross-Channel trade to a crawl. “We welcome France’s acknowledgement that in-depth discussions are needed to resolve the range of difficulties in the UK/EU relationship,” a UK government spokesperson said in a statement.
Industrial production in Germany unexpectedly fell in September as supply bottlenecks continued to take a toll on Europe’s largest economy. Germany’s Federal Statistics Office reported industrial output fell 1.1% on the month. Economists had expected a 1% decline. Compared with the previous quarter, production in the manufacturing sector fell by 2.4% in the third quarter and remains 9.5% lower than in February of 2020—right before the pandemic emerged. The fall was driven by a drop in the production of mechanical engineering, electrical equipment, and data processing equipment sectors, the economy ministry said. Thomas Gitzel, an economist at VP Bank, said Germany’s industrial production outlook remains bleak as companies expect material shortages to persist until the end of next year.
In Asia, President Xi Jinping said China is open to negotiations on subsidies to its industrial firms as well as state-owned companies, key points of trade tensions with the U.S. Xi said China will take an “active and open” attitude to talks on issues such as the digital economy, trade, the environment, industrial subsidies, and state-owned enterprises. The U.S. has long-standing concerns about the state-controlled structure of China’s economy and subsidies, and has repeatedly protested China’s “unfair, non-market practices.” Xi outlined a number of steps he would take to expand imports including building new zones for import facilitation, shortening China’s “negative list” for foreign investment, and expanding the number of industries where foreign investment is encouraged.
Japan’s household spending fell almost -2.0% in September from the same time last year as consumption was weighed down by sluggish car sales and a prolonged state of emergency over the coronavirus pandemic, government data showed. In the report, transportation and telecommunication outlays declined 6.5%, contributing the most to the overall decrease. Spending on vehicles has slowed and parts supplies have been disrupted by surges in coronavirus infections in Southeast Asia. A 3.5% fall in expenditures on food, including dining out, also weighed. Officials don’t expect consumer spending to improve anytime soon. “The situation over the virus is getting better, but household spending is unlikely to recover rapidly since the government has been relaxing (anti-virus measures) in stages,” a ministry official said.
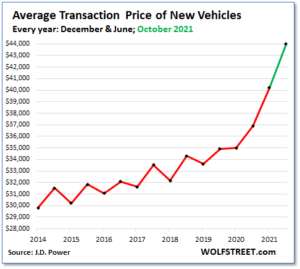
Finally: The average price of a new vehicle has spiked about 25% since the start of the pandemic, from about $35,000 to a whopping $44,000, according to auto data firm J.D. Power. Shortages of key materials, such as semiconductors, have not only limited the number of vehicles being produced, but also incentivized automakers to build only the most expensive, highest-trim versions of their vehicles. The result: automakers and dealers are making enormous amounts of gross profits per vehicle sold in their showrooms in a “take or leave it” scenario. In October, dealers made on average $5,129 per unit in gross profit, including contributions from finance and insurance (F&I) sales, smashing the prior record and up an amazing 75% from the same time last year. (Data: J.D. Power, chart: wolfstreet.com)
(Sources: All index- and returns-data from Yahoo Finance; news from Reuters, Barron’s, Wall St. Journal, Bloomberg.com, ft.com, guggenheimpartners.com, zerohedge.com, ritholtz.com, markit.com, financialpost.com, Eurostat, Statistics Canada, Yahoo! Finance, stocksandnews.com, marketwatch.com, wantchinatimes.com, BBC, 361capital.com, pensionpartners.com, cnbc.com, FactSet.) Securities offered through Registered Representatives of Cambridge Investment Research Inc., a broker-dealer, member FINRA/SIPC. Advisory Services offered through Cambridge Investment Research Advisors, a Registered Investment Adviser. Strategic Investment Partners and Cambridge are not affiliated. Indices mentioned are unmanaged and cannot be invested into directly. Past performance is no guarantee of future results.