
11-15-2021 Weekly Market Update
The very Big Picture
The long-term valuation of the market is commonly measured by the Cyclically Adjusted Price to Earnings ratio, or “CAPE”, which smooths-out shorter-term earnings swings in order to get a longer-term assessment of market valuation. A CAPE level of 30 is considered to be the upper end of the normal range, and the level at which further PE-ratio expansion comes to a halt (meaning that further increases in market prices only occur as a general response to earnings increases, instead of rising “just because”). The market is now above at that level.
Of course, a “mania” could come along and drive prices higher – much higher, even – and for some years to come. Manias occur when valuation no longer seems to matter, and caution is thrown completely to the wind – as buyers rush in to buy first, and ask questions later. Two manias in the last century – the “Roaring Twenties” of the 1920s, and the “Tech Bubble” of the late 1990s – show that the sky is the limit when common sense is overcome by a blind desire to buy. But, of course, the piper must be paid, and the following decade or two were spent in Secular Bear Markets, giving most or all of the mania-gains back.
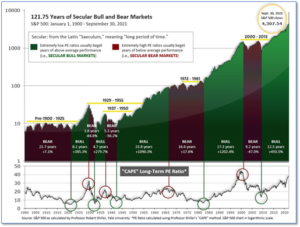
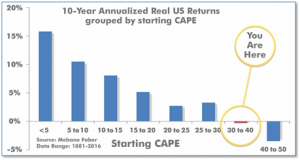
See Fig. 1 for the 100-year view of Secular Bulls and Bears. The CAPE is now at 39.51, down from the prior week’s 40.00. Since 1881, the average annual return for all ten-year periods that began with a CAPE in this range has been negative (see Fig. 2).
Note: We do not use CAPE as an official input into our methods. However, if history is any guide – and history is typically ‘some’ kind of guide – it’s always good to simply know where we are on the historic continuum, where that may lead, and what sort of expectations one may wish to hold in order to craft an investment strategy that works in any market ‘season’ … whether the current one, or one that may be ‘coming soon’!
The Big Picture:
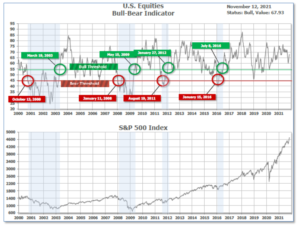
The ‘big picture’ is the (typically) years-long timeframe – the timeframe in which Cyclical Bulls and Bears operate. The U.S. Bull-Bear Indicator is in Cyclical Bull territory at 67.93, up from the prior week’s 66.95.
In the Quarterly- and Shorter-term Pictures
The Quarterly-Trend Indicator based on the combination of U.S. and International Equities trend-statuses at the start of each quarter – was Positive entering October, indicating positive prospects for equities in the fourth quarter of 2021.
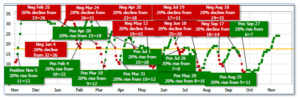
Next, the short-term(weeks to months) Indicator for US Equities turned positive on September 27 and ended the week at 24, up from the prior week’s 23.
In the Markets:
U.S. Markets: U.S. stocks retreated from record highs, as the highest inflation readings in three decades weighed on sentiment. The Dow Jones Industrial Average declined 228 points to finish the week at 36,100—a decline of -0.6%. The technology-heavy NASDAQ Composite retreated -0.7% to 15,861. By market cap, the large cap S&P 500 pulled back ‑0.3%, while the mid cap S&P 400 ticked down -0.1% and the small cap Russell 2000 closed down -1.0%.
International Markets: Major international markets finished the week predominantly in the green. Canada’s TSX rose 1.5%, while the United Kingdom’s FTSE 100 gained 0.6%. On Europe’s mainland, France’s CAC 40 and Germany’s DAX rose 0.7% and 0.2%, respectively. In Asia, China’s Shanghai Composite gained 1.4%. Japan’s Nikkei finished the week flat. As grouped by Morgan Stanley Capital International, developed markets retreated -0.5% and Emerging markets finished the week up 2.1%.
Commodities: Precious and base metals moved higher as investors reacted to news on the inflation front. Gold gained $51.70 to $1,868.50 per ounce, a gain of 2.9%. Silver finished the week up $1.19 to $25.35 per ounce, an increase of 4.9%. The industrial metal copper, viewed by some analysts as a barometer of world economic health due to its wide variety of uses, finished up 2.5%. Energy, however, pulled back for a third consecutive week. West Texas Intermediate crude oil declined -0.6% to $80.79 per barrel.
U.S. Economic News: The number of Americans filing first-time unemployment benefits slid to a new low for the pandemic era, as businesses continued to retain the workers they have and focus on finding more. The Labor Department reported new filings for jobless benefits dropped by 4,000 to 267,000 last week. Economists had expected new claims would total 265,000. Claims fell the most in California, Washington, and Louisiana. States with large numbers of autoworkers, such as Kentucky, Ohio, and Tennessee, had the most number of new filings as automakers shut down some assembly lines due to parts shortages. Meanwhile, continuing claims, which counts the number of people already collecting benefits, rose by 59,000 to 2.16 million. Despite the rise that number remains near its pandemic low.
A record number of Americans quit their jobs in September in the midst of the worst labor shortage in decades. The Labor Department reported 4.4 million people quit their jobs in September—a third consecutive record high. The latest reading brings the so-called ‘quit rate’ to 3% of the labor force—the highest level since the government began tracking it in 2000. Before the pandemic, the quit rate was fairly steady at about 2.3%. The leisure and hospitality sectors, which put workers directly in contact with customers, were the hardest hit. Nick Bunker, director of economic research at Indeed Hiring wrote, “Quits are up the most in sectors where most work is in-person or relatively low paying.” Including layoffs, retirements and deaths, some 6.2 million left their jobs in September in what has been dubbed “The Great Resignation.”
Optimism among the nation’s small business owners hit a seven-month low as they continued to struggle to find both people willing to work and supplies. The National Federation of Independent Business (NFIB) reported its small-business confidence index fell 0.9 points to 98.2 last month. It was the lowest reading since March. Businesses are facing one of the worst labor shortages since World War II. More than 4 million people left the workforce during the pandemic and haven’t returned. Furthermore, businesses are forced to pay sharply higher prices for key supplies—if they can find them at all. Business owners don’t expect their problems to be as “transitory” as the Federal Reserve believes. The measure of how small-business owners think the economy will perform over the next six months sank to its lowest level in almost nine years.
The cost of living surged again last month as Americans paid more for food, gas, and just about everything else. The government reported the consumer price index (CPI) jumped 0.9% last month—0.3% higher than economists had expected. Over the past year, inflation rose to 6.2% from 5.4% the prior month. That reading of the CPI is more than triple the Federal Reserve’s intended 2% target, and the highest reading since November of 1990. Another closely watched measure of inflation that omits the food and energy categories rose 0.6% last month. The so-called core rate climbed to 4.6% from 4% and also sits at a 30-year peak. Philadelphia Federal Reserve President Patrick Harker stated this week he was “acutely aware this period of rising prices is painful for many Americans.”
Prices at the producer and wholesale level surged again last month offering little hope that the biggest increase in inflation will wane anytime soon. The Bureau of Labor Statistics reported its Producer Price Index (PPI) rose 0.6% last month—in line with expectations. The wholesale cost of gasoline and some food categories both rose sharply to account for a large part of the increase. Americans are paying a lot more for fuel now than they were a year ago. The average cost of a gallon of gas nationwide is $3.38, up 54% from the same time last year. Since January, wholesale prices have climbed at least 0.5% every single month—before the pandemic they rose an average of 0.1% per month. The pace of wholesale inflation over the past 12 months remained steady at the elevated level of 8.6%. That’s the highest since the index was reconfigured in 2009, and likely one of the highest since the early 1980’s. The core rate, which strips out the food and energy categories, rose 0.4% last month. The increase in the core rate over the past 12 months moved up 0.3% to 6.2%.
International Economic News: At a policy announcement last month, the Bank of Canada became the first central bank from a G-7 country to exit its quantitative easing and signaled it could begin hiking interest rates as early as April of next year—three months earlier than previously anticipated. The BoC had planned to let activity in the current cycle run hotter than usual in an effort to boost employment, but its focus has now pivoted to moving inflation closer to its 2% target, analysts say. Inflation in Canada was at 4.4% in September—its highest level in nearly two decades. Money markets are signaling an expectation of a hike as soon as March and five in total next year.
Across the Atlantic, the United Kingdom’s economic recovery slowed sharply over the summer as Britain was hit by rising coronavirus infection rates, a third Covid-19 lockdown, and supply shortages. Figures from the Office for National Statistics show that national output expanded by 1.3% in the three months to September. Economists had expected an expansion of 1.5%. The reading remained 2.1% lower than it was at the end of 2019 right before the onset of the coronavirus pandemic. The third-quarter performance followed expansion of 5.5% in the three months to June–a period when restrictions on activity were being lifted. Of the three main parts of the economy, services recorded the fastest growth, up 1.6%. A 0.3% decline in manufacturing output restricted growth in the broader production sector to 0.8%, while construction recorded a 1.5% fall.
On Europe’s mainland, the German government’s panel of independent economic advisers cut its 2021 growth prediction for Europe’s biggest economy, the latest in a series of downgrades by forecasters. The German Council of Economic Experts cut its growth forecast for this year to 2.7%–down 0.4% from its earlier prediction in March. Higher energy prices and bottlenecks in supplies of raw materials and parts were responsible for the downgrade. However, on a positive note, it expected gross domestic product would expand by 4.6% in 2022, with the economy likely to return to its pre-pandemic size in next year’s first quarter.
In Asia, a leading emerging markets analyst warned China’s “zero-Covid” strategy will cause its economy to slow down further. Hao Zhou, senior emerging markets economist at Commerzbank stated, “If China continues to stick to its zero-Covid strategy, I think domestic demand will be under pressure.” The zero-Covid strategy typically involves strict lockdowns (even after the detection of just one or a handful of cases), extensive testing, heavily controlled or closed borders, as well as robust contact tracing systems and quarantine mandates. Many countries in Asia initially took an aggressive approach and tried to eliminate Covid within their borders, but most have gradually abandoned that strategy as lockdowns became less effective in controlling the virus. China’s economic growth has slowed in the wake of an energy crisis and concerns over real estate giant Evergrande and its debt burden.
Japan’s government cut its view on economic conditions for the first time in more than two years after a key indicator – current economic conditions – extended its decline in September to its lowest level in more than a year. Japan’s Cabinet Office reported its index showing current economic conditions, compiled from data including factory output, employment and retail sales, slipped a preliminary 3.8 points from the previous month to 87.5—its biggest decline since May 2020. The government lowered its assessment of the index to “weakening” from “improving” in its first downgrade since August 2019. A government official stated a slowdown in the shipment of vehicles and their components and factory output contributed to the significant decline.
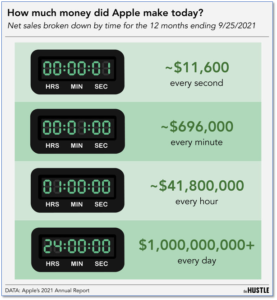
Finally: Apple is a money-making machine of astounding proportions. In the time it took you to read that sentence, Apple brought in $20k. And by the end of the day, Apple will have made a billion dollars in revenue – just today! Thehustle.co produced the graphic below showing the astounding rate at which Apple racks up sales revenue. It is breathtaking. (Data from Apple annual report, graphic from thehustle.co)
(Sources: All index- and returns-data from Yahoo Finance; news from Reuters, Barron’s, Wall St. Journal, Bloomberg.com, ft.com, guggenheimpartners.com, zerohedge.com, ritholtz.com, markit.com, financialpost.com, Eurostat, Statistics Canada, Yahoo! Finance, stocksandnews.com, marketwatch.com, wantchinatimes.com, BBC, 361capital.com, pensionpartners.com, cnbc.com, FactSet.) Securities offered through Registered Representatives of Cambridge Investment Research Inc., a broker-dealer, member FINRA/SIPC. Advisory Services offered through Cambridge Investment Research Advisors, a Registered Investment Adviser. Strategic Investment Partners and Cambridge are not affiliated. Indices mentioned are unmanaged and cannot be invested into directly. Past performance is no guarantee of future results.