
10-29-18 Weekly Market Update
The very big picture:
In the “decades” timeframe, the current Secular Bull Market could turn out to be among the shorter Secular Bull markets on record. This is because of the long-term valuation of the market which, after only eight years, has reached the upper end of its normal range.
The long-term valuation of the market is commonly measured by the Cyclically Adjusted Price to Earnings ratio, or “CAPE”, which smooths out shorter-term earnings swings in order to get a longer-term assessment of market valuation. A CAPE level of 30 is considered to be the upper end of the normal range, and the level at which further PE-ratio expansion comes to a halt (meaning that increases in market prices only occur in a general response to earnings increases, instead of rising “just because”).
Of course, a “mania” could come along and drive prices higher – much higher, even – and for some years to come. Manias occur when valuation no longer seems to matter, and caution is thrown completely to the wind as buyers rush in to buy first and ask questions later. Two manias in the last century – the 1920’s “Roaring Twenties” and the 1990’s “Tech Bubble” – show that the sky is the limit when common sense is overcome by a blind desire to buy. But, of course, the piper must be paid and the following decade or two are spent in Secular Bear Markets, giving most or all of the mania gains back.
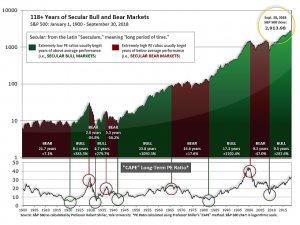
See Fig. 1 for the 100-year view of Secular Bulls and Bears. The CAPE is now at 30.00, down from the prior week’s 31.24, and exceeds the level reached at the pre-crash high in October, 2007. This value is in the lower end of the “mania” range. Since 1881, the average annual return for all ten year periods that began with a CAPE around this level have been in the 0% – 3%/yr. range. (see Fig. 2).

In the big picture:
The “big picture” is the months-to-years timeframe – the timeframe in which Cyclical Bulls and Bears operate. The U.S. Bull-Bear Indicator (see Fig. 3) is in Cyclical Bull territory at 58.57, down from the prior week’s 62.74.

In the intermediate and Shorter-term picture:
The Shorter-term (weeks to months) Indicator (see Fig. 4) turned positive on October 16th. The indicator ended the week at 2, down from the prior week’s 4. Separately, the Intermediate-term Quarterly Trend Indicator – based on domestic and international stock trend status at the start of each quarter – was positive entering October, indicating positive prospects for equities in the fourth quarter of 2018.

Timeframe summary:
In the Secular (years to decades) timeframe (Figs. 1 & 2), the long-term valuation of the market is simply too high to sustain rip-roaring multi-year returns – but the market has entered the low end of the “mania” range, and all bets are off in a mania. The only thing certain in a mania is that it will end badly…someday. The Bull-Bear Indicator (months to years) is positive (Fig. 3), indicating a potential uptrend in the longer timeframe. In the intermediate timeframe, the Quarterly Trend Indicator (months to quarters) is positive for Q4, and the shorter (weeks to months) timeframe (Fig. 4) is positive. Therefore, with three indicators positive and none negative, the U.S. equity markets are rated as Positive.
In the markets:
U.S. Markets: U.S. stocks experienced another week of sharp declines – the fourth down week of the last five. The large cap S&P 500 and the Nasdaq Composite indexes joined the small cap benchmarks in correction territory—down more than 10% from their recent peaks. The Dow Jones Industrial Average declined -3.0% this week, falling 756 points to close at 24,688. The technology-heavy Nasdaq Composite fell -3.8% to 7,167. By market cap, the large cap S&P 500 ended down -3.9%, while the mid cap S&P 400 fell -4.1% and the small cap Russell 2000 retreated -3.8%.
International Markets: Canada’s TSX finished down -3.8%. Across the Atlantic, major markets were down across the board. The United Kingdom’s FTSE retreated -1.6%, while France’s CAC 40 declined -2.3% and Germany’s DAX fell a further -3.1%. In Asia, China’s Shanghai Composite managed a gain of 1.9%, while Japan’s Nikkei plunged ‑6.0%. As grouped by Morgan Stanley Capital International, emerging markets were off -2.5%, while developed markets gave up -3.6%.
Commodities: Precious metals, a traditional safe haven in times of market weakness, finished green in an ocean of red. Gold rose 0.6% ending the week at $1235.80 an ounce, while Silver added 0.3% closing at $14.70 an ounce. Oil finished the week down as contracts for both West Texas Intermediate crude and Brent crude finished the week lower. West Texas Intermediate gave up -2.4% to $67.59 per barrel, while Brent declined -2.8% to $77.80 per barrel. Copper, seen by some analysts as an indicator of global economic growth due to its variety of industrial uses, ended the week down -1.3%.
U.S. Economic News: The number of Americans applying for initial unemployment benefits rose 5,000 to 215,000 last week, with claims particularly higher in Georgia and Florida recently hit by Hurricane Michael. Overall claims remain near a 50-year low, with employers laying off very few workers. Economists had expected claims to remain steady at 210,000. The four-week average of claims, smoothed to iron-out the weekly volatility, remained unchanged at 211,750. Continuing claims, which counts the number of people already receiving unemployment benefits, fell by 5,000 to 1.64 million. That number is at its lowest since August of 1973.
The housing market continued to deteriorate as sales of new homes plunged to near their lowest level in two years. The Commerce Department reported that new-home sales ran at a seasonally-adjusted annual rate of 553,000 last month, their lowest rate since December of 2016. September’s reading was 5.5% lower than August, and 13.2% lower than at the same time last year. Economists had forecast a pace of 620,000. In the details, the median selling price in September was $320,000, 3.5% lower than a year ago. At the current sales pace, there is now a 7.1 months’ supply of new homes on the market, above the 6-month level considered a “balanced” housing market and at a 6-year high. While the month-to-month government residential construction data can be quite volatile, overall the trend for 2018 is showing one of continued deterioration. Year-to-date sales are just 3.5% higher than at the same time last year—and that measurement has been steadily falling throughout the year.
On a positive note, the National Association of Realtors (NAR) reported its Pending Home Sales index edged up half a point to 104.6 last month. The consensus forecast was for no change. The NAR’s index tracks real estate transactions in which a contract has been signed but not yet closed. The Pending Home Sales index snapped a four-month losing streak with September’s increase, but held below year-ago levels for the ninth month in a row—this time by 1%. Contract signings usually precede closings by about 45 days so the pending home sales release is used by analysts as a leading indicator for the existing-home sales report.
Orders for goods intended to last at least 3 years, so-called “durable goods”, increased 0.8% in September. The reading was its third gain in the last four months, but was down sharply from August. The Commerce Department reported that while demand for durable goods continued to increase, it was down 4.6% from August. The swing was heavily influenced by the often-volatile aircraft category which fell 17.5% after surging 63.7% in August. Excluding the volatile transportation and defense sectors, core capital goods orders were down -0.1%.
Research firm IHS Markit reported the flash readings for both its manufacturing and services Purchasing Managers Indexes (PMI) increased this month. The Manufacturing PMI rose to a five-month high of 55.9, up 0.3 point, while its services PMI rose 1.2 point to 54.7. In both manufacturing and services, input cost inflation accelerated sharply, reflecting higher fuel and borrowing costs, as well as the impact of tariffs. Average prices charged also rose at a robust pace, suggesting an overall pickup in inflation. Chris Williamson, chief business economist at IHS Markit stated, “The resilience of the domestic economy in the face of trade worries, and the strong price pressures indicated by the survey data, will add to expectations that the Fed will hike rates again before the end of the year.”
A recent Federal Reserve report indicated some moderation in economic activity at the end of last quarter. The Chicago Federal Reserve’s National Activity Index decreased 0.1 point in September to 0.17, while the index’s three-month moving average fell 0.06 points to 0.21. Two of the four broad categories of indicators (production & sales, and orders & inventories) declined, however three of the four still made positive contributions to the index. Overall, the Diffusion Index which is based on 85 individual indicators remained unchanged at +0.18—a level consistent with a robust economy.
In the latest Federal Reserve ‘Beige Book’, a collection of anecdotal information on current economic conditions from each of its districts, wages, prices, and the labor market were the topics of concern among respondents. The Beige Book noted wages and prices moved higher in the Federal Reserve’s 12 districts through mid-October in a “modest to moderate” pace. In addition, tight labor markets remained a concern. Companies have resorted to using “non-wage strategies”, like bonuses and lengthy vacation allowances, to recruit workers. “Some” districts reported retailers in their regions were able to raise selling prices citing higher transportation costs and worries over wholesale price increases from trade tariffs. Overall economic activity expanded at a “modest to moderate” pace, the Beige Book said.
Real GDP growth marked its best two-quarter stretch in years, increasing at a 3.5% annual rate in the 3rd quarter, the Commerce Department reported. The reading beat consensus forecasts of 3.4% but was a modest deceleration from the 4.2% rate of growth seen in the second quarter. So far this year, growth has averaged 3.3% keeping the economy on track for close to 3% growth for the full year. Notably, output was up 3% year over year, its fastest pace since the second quarter of 2015. The latest reading reflected strong growth in consumer spending and inventory investment, while declines in fixed investment and net exports weighed. Domestic demand remained robust as final sales to domestic purchasers rose at a 3.1% annual rate, above the long-term average of 2.8%.
International Economic News: The Bank of Canada raised its key interest rate a quarter point to 1.75%, the highest level in about a decade. The increase was the fifth time the Bank of Canada has hiked rates since the summer of 2017. The hike comes as Canada’s economy has remained resilient amid (now resolved) trade tensions with the United States and an unemployment rate near four-decade lows. The increase followed Bank of Canada Governor Stephen Poloz’s first policy meeting since Canada agreed to an updated North American free trade deal with the U.S. and Mexico earlier this month. The bank said the new trade agreement will reduce uncertainty, which it described as “an important curb” on business confidence and investment.
Bloomberg reported United Kingdom Prime Minister Theresa May’s Cabinet is nowhere close to agreeing to a way forward for high level Brexit negotiations to resume, even as time is running short. Sources told Bloomberg that there would almost certainly be no new plan put forward by the British side before Britain’s next budget. Bloomberg further reported a main source of contention remains Britain’s border with Ireland which would be the only land crossing between the two jurisdictions.
France, Europe’s second-largest economy, received a letter from the European Union warning that its planned debt reduction in 2019 does not respect the proposals that Paris had agreed to in a previous agreement with the EU. France’s 2019 budget plan forecasts its structural deficit (the difference between spending and revenues) falling 0.1% this year and 0.3% next year. Earlier this year, Paris had agreed to an annual reduction of 0.6% of GDP for its structural deficit. Daniel Lacalle, chief economist and investment officer at Tressis Gestion stated France’s 2019 budget “shows that the government relies heavily on very optimistic revenues to achieve fiscal consolidation and that spending is out of control again. In the case of France, it is a very difficult budget to accept by the European Commission because France has not had a balanced budget since 1974 and has missed its own deficit targets more than eleven times.”
The Munich-based Ifo economic institute reported its business climate index for Germany fell a second month in a row to 102.8, missing economists’ forecasts by 0.4 point. Ifo chief Clemens Fuest stated, “Firms were less satisfied with their current business situation and less optimistic about the months ahead.” In addition, “Growing global uncertainty is increasingly taking its toll on the German economy.” Domestic consumption and state spending have been Germany’s main growth drivers as exports have weakened. But the risk of a no-deal Brexit, trade tensions, and a lack of skilled workers are weighing on growth prospects for Europe’s largest economy. Ifo economist Klaus Wohlrabe said it would be difficult for Germany to meet the 0.6% growth forecast for the fourth quarter given by the institute in its autumn report.
Analysts note that it appears China is set to build its way out of its next economic downturn—again. Based on official data, Reuters found that China’s state planner had approved 45 projects worth 437.4 billion yuan in the third quarter, more than quadruple the 90.5 billion yuan approved in the second. The September approvals accounted for nearly 2/3’s of the value of approvals so far this year. The steep increase in approved projects follows the release of data last week that showed China’s economy grew 6.5% so far this year, it’s weakest pace since 2009. On top of boosting investment, Chinese policymakers have also announced a raft of measures to support household consumption in recent days, including income tax cuts and additional tax deductions.
The Bank of Japan is set to keep its monetary policy steady next week and maintain its optimistic view of the economy according to analysts. However, given Japan’s export-reliant economy, Japanese policymakers worry that rising protectionism and volatile financial markets could hurt business sentiment by discouraging firms from raising wages. The Bank of Japan’s plan relies on companies raising wages to stoke growth. Given its reliance on exports, solid global demand is a necessary predecessor ingredient for Japanese companies to raise wages and prices. The BOJ is widely expected to maintain a pledge to guide short-term interest rates at minus 0.1% and long-term rates around 0%. It is also seen roughly maintaining its growth and inflation projections in a quarterly review of its long-term forecasts.
Finally: Needless to say, investor anxiety is running high. CNN’s Fear & Greed Index has swung from a reading of 70 indicating “Greed” down to just 7 indicating “Extreme Fear” in the span of just one month.

Market blogger and Chartered Market Technician Ryan Detrick looked for other instances of similar market turmoil in previous Octobers. Detrick found that since 1950 there have been 7 other years that were positive year-to-date going into October and saw the S&P 500 turn negative year-to-date during the month. “The good news”, he writes, “is the final two months were higher 6 times and up 4.1% on average.”

(sources: all index return data from Yahoo Finance; Reuters, Barron’s, Wall St Journal, Bloomberg.com, ft.com, guggenheimpartners.com, zerohedge.com, ritholtz.com, markit.com, financialpost.com, Eurostat, Statistics Canada, Yahoo! Finance, stocksandnews.com, marketwatch.com, wantchinatimes.com, BBC, 361capital.com, pensionpartners.com, cnbc.com, FactSet) These are the opinions of WE Sherman and Co and not necessarily those of Cambridge, are for informational purposes only, and should not be construed or acted upon as individualized investment advice.
Securities offered through Registered Representatives of Cambridge Investment Research Inc., a broker-dealer, member FINRA/SIPC. Advisory Services offered through Cambridge Investment Research Advisors, a Registered Investment Adviser. Strategic Investment Partners and Cambridge are not affiliated.
Indices mentioned are unmanaged and cannot be invested into directly. Past performance is no guarantee of future results. All Investing involves risk. Depending on the types of investments, there may be varying degrees of risk. Investors should be prepared to bear loss, including total loss of principal.