
10-15-18 Weekly Market Update
The very big picture:
In the “decades” timeframe, the current Secular Bull Market could turn out to be among the shorter Secular Bull markets on record. This is because of the long-term valuation of the market which, after only eight years, has reached the upper end of its normal range.
The long-term valuation of the market is commonly measured by the Cyclically Adjusted Price to Earnings ratio, or “CAPE”, which smooths out shorter-term earnings swings in order to get a longer-term assessment of market valuation. A CAPE level of 30 is considered to be the upper end of the normal range, and the level at which further PE-ratio expansion comes to a halt (meaning that increases in market prices only occur in a general response to earnings increases, instead of rising “just because”).
Of course, a “mania” could come along and drive prices higher – much higher, even – and for some years to come. Manias occur when valuation no longer seems to matter, and caution is thrown completely to the wind as buyers rush in to buy first and ask questions later. Two manias in the last century – the 1920’s “Roaring Twenties” and the 1990’s “Tech Bubble” – show that the sky is the limit when common sense is overcome by a blind desire to buy. But, of course, the piper must be paid and the following decade or two are spent in Secular Bear Markets, giving most or all of the mania gains back.
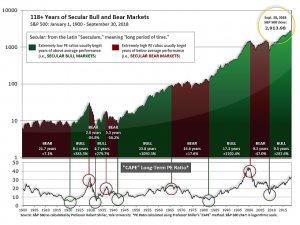
See Fig. 1 for the 100-year view of Secular Bulls and Bears. The CAPE is now at 31.23, down from the prior week’s 32.71, and exceeds the level reached at the pre-crash high in October, 2007. This value is in the lower end of the “mania” range. Since 1881, the average annual return for all ten year periods that began with a CAPE around this level have been in the 0% – 3%/yr. range. (see Fig. 2).

In the big picture:
The “big picture” is the months-to-years timeframe – the timeframe in which Cyclical Bulls and Bears operate. The U.S. Bull-Bear Indicator (see Fig. 3) is in Cyclical Bull territory at 66.94, down from the prior week’s 71.33.

In the intermediate and Shorter-term picture:
The Shorter-term (weeks to months) Indicator (see Fig. 4) turned negative on October 4th. The indicator ended the week at 7, down sharply from the prior week’s 18. Separately, the Intermediate-term Quarterly Trend Indicator – based on domestic and international stock trend status at the start of each quarter – was positive entering October, indicating positive prospects for equities in the fourth quarter of 2018.

Timeframe summary:
In the Secular (years to decades) timeframe (Figs. 1 & 2), the long-term valuation of the market is simply too high to sustain rip-roaring multi-year returns – but the market has entered the low end of the “mania” range, and all bets are off in a mania. The only thing certain in a mania is that it will end badly…someday. The Bull-Bear Indicator (months to years) is positive (Fig. 3), indicating a potential uptrend in the longer timeframe. In the intermediate timeframe, the Quarterly Trend Indicator (months to quarters) is positive for Q4, and the shorter (weeks to months) timeframe (Fig. 4) is negative. Therefore, with two indicators positive but one negative, the U.S. equity markets are rated as Neutral.
In the markets:
U.S. Markets: Stocks fell sharply this week with the large cap S&P 500 index losing more than 5% on Wednesday and Thursday combined, the largest two-day drop since early February. Stocks managed a bounce on Friday with the S&P 500 ending the week down -4.1%. The Dow Jones Industrial Average gave up more than 1100 points to close at 25,339, down -4.2%. Smaller cap stocks continued to get the short end of the stick. The S&P 400 mid cap index retreated -4.9%, while the small cap Russell 2000 finished down -5.2%.
International Markets: Canada’s TSX finished down for a third week by giving up -3.3%, while across the Atlantic the United Kingdom’s FTSE fell a steeper -4.4%. On Europe’s mainland, major markets were also all down. France’s CAC 40 and Germany’s DAX each retreated -4.9%, while Italy’s Milan FTSE ended down -5.4%. In Asia, China’s Shanghai Composite plunged -7.6% while Japan’s Nikkei ended down -4.6%. As grouped by Morgan Stanley Capital International, developed markets fell -3.9% while emerging markets lost -1.4%, helped in no small part by a big pop in Brazil where the conservative presidential candidate won the first round of presidential voting.
Commodities: Amid all the stock market weakness, some investors sought refuge in precious metals. Gold ended the week up 1.4%, at $1222 per ounce, while Silver was off just a penny at $14.63 an ounce. Energy finished down for the week with Brent North Sea crude oil off -4.2% to $80.60 per barrel, while West Texas Intermediate crude oil closed at $71.34 per barrel, down -4.0%. The industrial metal copper, seen by some analysts as a measure of world economic growth due to its variety of industrial uses, finished the week up 1.4%.
U.S. Economic News: The number of people seeking new unemployment benefits climbed 7,000 to 214,000 last week—a modest increase but remaining near historically low levels. Economists had predicted a reading of 205,000. The less-volatile monthly average of new claims increased by 2,500 to 209,500. The low number of layoffs continues to reflect the tightest labor market in half a century. Job openings remain at a record high and unemployment is near a 48-year low of 3.7%. The number of people already receiving unemployment benefits, known as “continuing claims”, edged up 4,000 to 1.66 million. That number is also near a 45-year low.
Sentiment among the nation’s small business owners pulled back from its 45-year high last month according to the National Federation of Independent Business (NFIB). The NFIB’s small business optimism index fell 0.9 point in September to a seasonally-adjusted level of 107.9. In the report, six of the index components declined, three gained, and one remained unchanged. Still, NFIB President Juanita Duggan noted “This is the longest streak of small business optimism in history, evidence that tax cuts and regulatory rollbacks are paying off for the economy as a whole. Our members say that business is booming and prospects continue to look bright.”
Prices at the wholesale level rebounded 0.2% in September, matching consensus expectations for the Producer Price Index (PPI). Ex food and energy, the PPI also rose 0.2%. In the details, the services sector PPI advanced 0.3%, led by a 1.8% jump in transportation and warehousing prices, while the goods sector PPI slipped 0.1% – its first decline since May of 2017. Year-over-year, final demand PPI eased 0.1% to 2.7%, while core PPI edged up to 2.5% indicating there was little change in inflation at the producer level. The Federal Reserve is sticking to its forecast that overall inflation will remain around its target 2%, allowing it to carry on its current strategy of gradually raising U.S. interest rates. Economists at Oxford Economics wrote, “This latest inflation data corroborates our view that the Fed is likely to move ahead with another rate hike in December, bringing this year’s total to four.”
Consumer prices ticked up in September, according to the latest data from the Bureau of Labor Statistics. The Bureau of Labor Statistics’ Consumer Price Index (CPI) edged up 0.1% last month, the smallest gain in six months. On a year over year basis, the CPI eased to 2.3% from 2.7% the prior month—its slowest rise since February. Core CPI, which removes the volatile food and energy categories, also rose 0.1%. Year over year core CPI held steady at 2.2%. So far, global tariffs have not created an inflation issue just yet, as the strength of the U.S. dollar has offset some of the price impact. About half of the increase in the CPI last month was attributed to higher rents and the rising cost of home ownership.
Sentiment among the nation’s consumers slipped but still remained near a 15-year high, according to the latest University of Michigan survey. The survey of 500 consumers’ outlook on economic prospects fell just short of expectations hitting a level of 99 in its preliminary reading, below the 100.4 expected. Richard Curtin, chief economist for the survey stated, “Consumer sentiment slipped in early October, although it remained at quite favorable levels and just above the average reading during 2018.” Notably, the survey revealed growing bipartisan support for the government’s economic policies. Curtin noted, “Most of the October gain was due to an upward adjustment by Democrats, although their evaluations were still well below the much more favorable evaluations of Republicans.”
International Economic News: The International Monetary Fund cut its growth forecast for the global economy for the next two years as economic risks are on the rise. The IMF cut its growth forecast for the global economy in 2018 and 2019 to 3.7%, down -0.2% from its prior estimate for both years. The change reflects weaker growth in the world’s advanced economies, rising trade tensions, and higher oil prices. IMF chief economist Maurice Obstfeld stated recent data showed global trade weakening, as well as weakness in manufacturing and investment. Obstfeld noted that for the United States, the Trump tax cuts should lift the U.S. economy until 2020, but when the stimulus expires and as growth in China continues to slow, Obstfeld said “global growth is set to moderate.”
After Canada achieved robust 3% economic growth in 2017, accounting firm Deloitte & Touche now expects the Canadian economy to slow to 2% growth for 2018, slightly lower in 2019, and just 1.4% by 2020. Deloitte Economic Advisory stated that high household debt, rising interest rates, flat real estate markets, and weaker employment growth will all weigh on consumer spending in 2019 and 2020. Along with U.S. protectionism posing a risk in global growth, tighter monetary policy in North America and Europe will also play a role the firm said. Deloitte Canada’s Chief Economist, Craig Alexander stated, “The signs that the North American economy is in the late stages of a business cycle are all around us, from a record long bull market in US equities to low unemployment rates and rising central bank rates.”
As Brexit negotiations have come to a standstill, former British Prime Minister Tony Blair announced the United Kingdom should call for a referendum to allow voters to choose between a no-deal Brexit and staying in the European Union. Less than six months before the United Kingdom’s exit from the European Union, there is little clarity about how the world’s fifth largest economy and its financial center of London will continue to trade with the EU after Brexit. Some members of her Conservative Party are unhappy about the Brexit proposals she has made while the main opposition Labour Party has indicated it is likely to vote down any deal May proposes. Blair said he did not expect May to be able to get a deal through parliament so the country should be offered a new vote.
The German government cut its economic growth forecasts for this year and the next citing global trade uncertainty, but noted that the underlying up trend nevertheless remains intact. Germany’s economic growth is now expected to come in at 1.8% this year, down a sizeable 0.5% from its previous forecast. In addition, next year’s growth rate is expected to be 1.8% as well, down 0.4% from the last estimate. Last year, Germany expanded 2.2%. Peter Altmaier, Germany’s Economics Minister, stated “The German economy is still in an upswing and will continue this upswing for the tenth consecutive year next year -the longest upswing period since 1966.” Furthermore, “Uncertainties regarding its future performance are caused by increasing protectionist tendencies and international trade conflicts. They harm all parties involved,” he said.
In a bid to end trade war tensions, U.S. President Donald Trump and Chinese leader Xi Jinping have agreed to meet next month at the G-20 summit in Buenos Aires in hopes of resolving their escalating trade conflict. The discussion, which Beijing initiated, would represent the first direct talks since August. However, with U.S.-China relations continuing to deteriorate few analysts are expecting a major breakthrough. Michael Pillsbury, director of the Center on Chinese Strategy at the Hudson Institute stated, “The problem is neither side seems to be confident that it understands the other side’s bottom line negotiating demand.” The agreement to restart negotiations comes three weeks after Trump added tariffs to $200 billion in Chinese imports.
Bank of Japan (BOJ) board member Makoto Sakurai warned this week that the spread of protectionist trade policies was creating uncertainty in the global economy and could slow Japan’s economic growth below the BOJ’s projections. Mr. Sakurai said the BOJ should continue its strong monetary stimulus for the time being, as well as monitoring for side-effects of the prolonged easing. The BOJ’s policy board forecast Japan’s economy would grow 1.5% this fiscal year and 0.8% in the following two years – around the same level as its growth potential. Under its yield curve control policy, the BOJ has pledged to guide short-term interest rates to negative 0.1% and to cap the 10-year government bond yield around zero percent.
Finally: After the market volatility last week many are beginning to wonder if the bull market is over, or just taking a break. Nick Maggiulli, analytics manager at Ritzholtz Wealth Management, offered his prediction for the market based on the fundamental concept of economics. Basically, when the average investor allocation to stocks is high (greater than 70%), returns for the following 10 years tend to be low, and investors should buy bonds. Oppositely, when average investor allocation to stocks is low (less than 50%), the following 10 year returns tend to be high. Therefore, investors should then sell their bonds and buy stocks. Since 1987, investing in this manner would have turned $1 into $43, versus just $24 for the buy-and-hold crowd. And where is the indicator now? According to the model, investors should have sold stocks last December when allocations crossed the 70% threshold. Since then, allocations have remained in the 65% – 73% range, nowhere near the 50% threshold for buying again.

(sources: all index return data from Yahoo Finance; Reuters, Barron’s, Wall St Journal, Bloomberg.com, ft.com, guggenheimpartners.com, zerohedge.com, ritholtz.com, markit.com, financialpost.com, Eurostat, Statistics Canada, Yahoo! Finance, stocksandnews.com, marketwatch.com, wantchinatimes.com, BBC, 361capital.com, pensionpartners.com, cnbc.com, FactSet) These are the opinions of WE Sherman and Co and not necessarily those of Cambridge, are for informational purposes only, and should not be construed or acted upon as individualized investment advice.
Securities offered through Registered Representatives of Cambridge Investment Research Inc., a broker-dealer, member FINRA/SIPC. Advisory Services offered through Cambridge Investment Research Advisors, a Registered Investment Adviser. Strategic Investment Partners and Cambridge are not affiliated.
Indices mentioned are unmanaged and cannot be invested into directly. Past performance is no guarantee of future results. All Investing involves risk. Depending on the types of investments, there may be varying degrees of risk. Investors should be prepared to bear loss, including total loss of principal.