
8-20-18 Market Update
The very big picture:
In the “decades” timeframe, the current Secular Bull Market could turn out to be among the shorter Secular Bull markets on record. This is because of the long-term valuation of the market which, after only eight years, has reached the upper end of its normal range.
The long-term valuation of the market is commonly measured by the Cyclically Adjusted Price to Earnings ratio, or “CAPE”, which smooths out shorter-term earnings swings in order to get a longer-term assessment of market valuation. A CAPE level of 30 is considered to be the upper end of the normal range, and the level at which further PE-ratio expansion comes to a halt (meaning that increases in market prices only occur in a general response to earnings increases, instead of rising “just because”).
Of course, a “mania” could come along and drive prices higher – much higher, even – and for some years to come. Manias occur when valuation no longer seems to matter, and caution is thrown completely to the wind as buyers rush in to buy first and ask questions later. Two manias in the last century – the 1920’s “Roaring Twenties” and the 1990’s “Tech Bubble” – show that the sky is the limit when common sense is overcome by a blind desire to buy. But, of course, the piper must be paid and the following decade or two are spent in Secular Bear Markets, giving most or all of the mania gains back.

See Fig. 1 for the 100-year view of Secular Bulls and Bears. The CAPE is now at 32.84, up slightly from the prior week’s 32.80, and exceeds the level reached at the pre-crash high in October, 2007. This value is in the lower end of the “mania” range. Since 1881, the average annual return for all ten year periods that began with a CAPE around this level have been in the 0% – 3%/yr. range. (see Fig. 2).

In the big picture:
The “big picture” is the months-to-years timeframe – the timeframe in which Cyclical Bulls and Bears operate. The U.S. Bull-Bear Indicator (see Fig. 3) is in Cyclical Bull territory at 74.90, up from the prior week’s 73.46.

In the intermediate and Shorter-term picture:
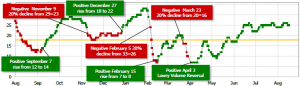
The Shorter-term (weeks to months) Indicator (see Fig. 4) turned positive on April 3rd. The indicator ended the week at 25, down from the prior week’s 26. Separately, the Intermediate-term Quarterly Trend Indicator – based on domestic and international stock trend status at the start of each quarter – was positive entering July, indicating positive prospects for equities in the third quarter of 2018.
Timeframe summary:
In the Secular (years to decades) timeframe (Figs. 1 & 2), the long-term valuation of the market is simply too high to sustain rip-roaring multi-year returns – but the market has entered the low end of the “mania” range, and all bets are off in a mania. The only thing certain in a mania is that it will end badly…someday. The Bull-Bear Indicator (months to years) is positive (Fig. 3), indicating a potential uptrend in the longer timeframe. In the intermediate timeframe, the Quarterly Trend Indicator (months to quarters) is positive for Q3, and the shorter (weeks to months) timeframe (Fig. 4) is positive. Therefore, with all three indicators positive, the U.S. equity markets are rated as Positive.
In the markets:
U.S. Markets: Most of the major U.S. indexes closed higher for the week as large declines on Wednesday were offset by a strong rally on Thursday. The Dow Jones Industrial Average added 356 points for the week, closing at 25,669 for a gain of 1.4%. The technology-heavy NASDAQ Composite, however, reversed last week’s gain and fell ‑0.3%. By market cap, mid caps led the way with a 0.7% gain, while the large cap S&P 500 index rose 0.6% and small cap Russell 2000 added 0.4%.
International Markets: Canada’s TSX ended the week essentially flat, down just -0.02%. In Europe major markets finished the week in the red with the United Kingdom’s FTSE off by -1.4%, while France’s CAC 40 and Germany’s DAX down -1.3% and -1.7%, respectively. In Asia, China’s Shanghai Composite and Hong Kong’s Hang Seng plunged -4.5% and -4.1%, while Japan’s Nikkei managed a loss of just -0.1%. As grouped by Morgan Stanley Capital International, emerging markets finished down a third consecutive week, off -2.3%, while developed markets ended the week down -0.4%.
Commodities: Energy finished down a third consecutive week with West Texas Intermediate crude oil closing at $65.21 per barrel, a loss of -3.6%. Precious metals continued their downtrend as well. Gold retreated -2.9% to close at $1,184.20 an ounce, while Silver gave up -4.3%, closing out the week at $14.63 an ounce. Copper, seen by some analysts as an indicator of global economic health due to its variety of uses, fell for a third straight week by falling over -4%.
U.S. Economic News: The number of Americans applying for new unemployment benefits fell again last week, back to near their post-recession lows. The Labor Department reported Initial Jobless Claims declined by 2,000 to 212,000. Economists had forecast a reading of 215,000. The more stable monthly average of new claims declined 1,000 to 215,500. Layoffs remain near their lowest levels of the past 50 years. Continuing claims, which counts the number of people already collecting unemployment benefits, dropped by 39,000 to 1.72 million. Chief economist Stephen Stanley of Amherst Pierpont Securities stated, “Initial claims appear to be trending gently lower this year from levels that were already the lowest in decades.”
Confidence among the nation’s homebuilders continued to wane, according to the National Association of Home Builders (NAHB). The NAHB’s builder sentiment index ticked down one point to 67 in August, continuing a downtrend that began in May. In its release the NAHB called the reading “solid”, but noted it lags the 2017 full-year average of 68. In the report, the index’s two sub-gauges, which measure attitudes about the current pace of sales and expected sales over the coming six months, each ticked down one point, to 73 and 72. The tracker of buyer traffic fell two points to 49. The industry group’s chief economist stated, Builders “continue to monitor how tariffs and the growing threat of a trade war are affecting key building material prices, including lumber.” The Associated General Contractors of America, another builder industry group, reported that lumber and plywood costs have increased over 16.3% over the past 12 months and other building raw materials like aluminum have also seen double-digit increases.
The number of new homes under construction increased by less than 1% last month, reflecting a recent slowdown in building. The Commerce Department reported housing starts edged up to an annual rate of 1.17 million units, missing forecasts of a 1.27 million reading. However, in a positive sign for future building activity, permits rose 1.5% to a 1.31 million annual pace. In the details, housing starts surged 11.6% in the Midwest and 10.4% in the South but were off 11% in the West and 4% in the Northeast. By type, builders broke ground on an annualized 862,000 single-family homes and 303,000 multi-unit dwellings. The reading came as a disappointment to analysts who were looking for a rebound in housing. Ian Shepherdson, chief economist for Pantheon Macro stated, “We expected a much bigger rebound in starts after June’s surprise plunge – which was revised down – so this is disappointing.” The number of housing starts in July was 1.4% lower compared to the same month in 2017.
Sentiment among the nation’s consumers fell to an 11-month low as households expressed concerns about the rising cost of living. The University of Michigan reported its consumer sentiment index fell 2.6 points to 95.3 – the weakest reading since September 2017. UMich stated the decline in sentiment was concentrated primarily among households in the bottom third of the income distribution, adding that consumers’ views on prices for big-ticket household goods were the least favorable in nearly 10 years. Inflation has been on the rise in recent months, driven by a combination of strong domestic demand, tight labor markets, and protectionist trade policies. Along with big ticket items the University of Michigan survey also showed consumers’ perceptions about home buying conditions were the least favorable in 10 years and their views on house prices were the worst since 2006.
Among the nation’s small business owners sentiment climbed in July to its second-highest level ever recorded. The National Federation of Independent Business (NFIB) reported its small business optimism index rose 0.7 points to 107.9 – just shy of the peak hit 35 years ago in 1983. In the details, eight of the ten components registered gains with ‘plans to increase employment’ and ‘expectations for rising sales and expansion’ leading, while ‘current inventories’ and ‘plans to increase inventories’ weighed. The single most important issue facing small businesses continues to be concerns about the quality of labor, or more precisely the availability of quality labor.
The Commerce Department reported sales at the nation’s retailers rose a solid 0.5% in July, a positive sign for the economy at midsummer. The reading exceeded economists’ forecasts by 0.1%. Retail sales have increased 6.4% over the past year. In the details, clothing stores and restaurants led the way with a 1.3% increase, while department stores, internet retailers and gas stations also performed well. Gregory Daco, chief U.S. economist at Oxford Economics, noted, “The July retail sales report indicates that the momentum heading into the third quarter remains solid, which bodes well for consumer demand and overall economic growth.”
Industrial production ticked up 0.1% in July, the Federal Reserve reported. Rising manufacturing output offset declines in both mining and utilities. The reading missed economists’ expectations of a 0.3% increase. Over the past year, industrial production has risen 4.2% – its strongest gain in more than six years. Mining had its first drop in six months as oil prices continued to rebound. Still, mining output stands nearly 13% higher than at the same time last year. Andrew Grantham of CIBC World Markets stated in a note, “Overall, given that there was a big upward revision to June, and that some of the disappointment in July reflected the volatile utilities area, this is a solid set of figures that points to continued momentum for the U.S. industrial sector at the start of Q3.”
The Conference Board reported its index of Leading Economic Indicators (LEI) rose again in July, suggesting that the U.S. economy will continue to expand at a solid pace for at least the rest of the year. The LEI increased 0.6% last month to 110.7, exceeding forecasts of a 0.5% gain. Comprising 10 factors, including initial claims for jobless benefits, factory orders, and the performance of the S&P 500 index, the index is designed to signal swings in the business cycle and to smooth out the volatility of the individual indicators. Ataman Ozyildirim, director of business cycles and research at the Conference Board added “The strengths among the components of the leading index were very widespread, with unemployment claims, the financial components, and the ISM New Orders Index making the largest positive contributions.”
International Economic News: Canada’s inflation rose to a near seven-year high last month, led by higher costs for gasoline and air transportation. Canada’s consumer price index rose 3.0% on a year-over-year basis in July, according to Statistics Canada. The rise follows a 2.5% annualized increase the previous month. The last time headline inflation advanced at 3% or higher was in September of 2011. However, the July report showed that underlying, or core, inflation edged up only slightly from the previous month. Core inflation, which excludes the often volatile food and energy components, rose in a range from 1.9%-2.1% based on the three preferred gauges used by the Bank of Canada. Like the U.S., Canada’s central bank has set its policies to achieve and maintain approximately a 2% rate of inflation.
Unemployment in the United Kingdom fell by 65,000 to 1.36 million in the second quarter – the lowest level in more than 40 years official data shows. The UK’s Office for National Statistics reported the unemployment rate fell to just 4%, the lowest since 1975 and better than economists’ forecasts. One concern, however, is that pay growth slowed to its weakest in nine months. The figures paint a picture of a tight labor market with a record number of job vacancies, but failing to translate into strong wage growth. The Bank of England is waiting for wage growth to justify further rate hikes. The BoE has raised interest rates only twice since the end of the financial crisis.
French President Emmanuel Macron has pledged to boost economic ties with Turkey in the midst of Turkey’s trade dispute with the United States. Macron and his Turkish counterpart President Erdogan discussed the importance of developing economic and trade ties and boosting bilateral investment in a phone call this week. The two nations’ finance ministers, Berat Albayrak and Bruno Le Maire, will meet “as soon as possible” according to a Turkish presidential source.
The German economy accelerated in the second quarter, growing at a quarterly rate of 0.5%, or 1.8% in annualized terms, the Germany’s Federal Statistics Office reported. It also raised its first-quarter growth estimate to an annualized 1.5%, up 0.3% from the number reported in May. Germany’ statistics body said that the pickup in the German economy was led by domestic demand, concurrent with a rise in households and government spending. Private consumption is expected to remain solid in the coming months, supported by a healthy labor market and rising wages. However, rising inflation is partly eroding higher pay.
The Trump administration and China agreed to resume trade talks for the first time in more than two months. The news triggered the biggest stock surge in four months. Top White House economic adviser Larry Kudlow said that China would send its vice commerce minister Wang Shouwen for talks in Washington with U.S. Treasury undersecretary for international affairs David Malpass. While not necessarily a breakthrough, Brookings Institute senior China fellow David Dollar indicated they were a positive step towards preventing further escalation. “They’re talking about talking”, he said. Rajiv Biswas, Asia Pacific chief economist at IHS Markit stated, “Wang Shouwen faces a very difficult negotiation to try to bridge the large gulf in positions between China and the US. Although the resumption of US-China trade talks is good news, the process of finding a trade deal is likely to be protracted.”
Japan’s politically sensitive trade surplus with the United States shrank sharply last month as the two nations continue to dispute trade policy. Japan’s surplus with the U.S. shrank 22.1% with reduced shipments of motor vehicles and microchip-making equipment weighing the most. Overall, Japan logged a trade deficit of 231.2 billion yen (S$2.76 billion) last month, compared to a surplus of 406.6 billion yen recorded in the same month last year. With the yen strengthening against the dollar, exports registered their slowest growth in four months, rising 3.6% year-on-year. Meanwhile, imports jumped 14.6%.
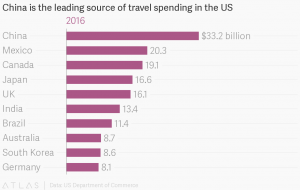
Finally: As everyone knows, we are in a trade war of sorts with China over imports, exports and tariffs. Simply put, we want to sell more stuff to China with fewer restrictions and tariffs. There is one area, usually overlooked in these discussions, that has been growing rapidly – and in our favor: tourism. We “sell” tourism to China in a very big way, and it is (so far, at least) done with no tariffs and few restrictions above and beyond the usual visa requirements. Here, from the most recent data available from the Commerce Department, is a chart showing that China is far and away the source of more tourist dollars than any other country on earth. (Chart from theatlas.com)
(sources: all index return data from Yahoo Finance; Reuters, Barron’s, Wall St Journal, Bloomberg.com, ft.com, guggenheimpartners.com, zerohedge.com, ritholtz.com, markit.com, financialpost.com, Eurostat, Statistics Canada, Yahoo! Finance, stocksandnews.com, marketwatch.com, wantchinatimes.com, BBC, 361capital.com, pensionpartners.com, cnbc.com, FactSet; Figs 1-5 source W E Sherman & Co, LLC)
These are the opinions of WE Sherman and Co and not necessarily those of Cambridge, are for informational purposes only, and should not be construed or acted upon as individualized investment advice.
Securities offered through Registered Representatives of Cambridge Investment Research Inc., a broker-dealer, member FINRA/SIPC. Advisory Services offered through Cambridge Investment Research Advisors, a Registered Investment Adviser. Strategic Investment Partners and Cambridge are not affiliated.
Indices mentioned are unmanaged and cannot be invested into directly. Past performance is no guarantee of future results. All Investing involves risk. Depending on the types of investments, there may be varying degrees of risk. Investors should be prepared to bear loss, including total loss of principal.