
1-2-2023 Weekly Market Update
The very Big Picture
The long-term valuation of the market is commonly measured by the Cyclically Adjusted Price to Earnings ratio, or “CAPE”, which smooths-out shorter-term earnings swings in order to get a longer-term assessment of market valuation. A CAPE level of 30 is considered to be the upper end of the normal range, and the level at which further PE-ratio expansion comes to a halt (meaning that further increases in market prices only occur as a general response to earnings increases, instead of rising “just because”). The market was recently above that level, and has fallen back.
Of course, a “mania” could come along and drive prices higher – much higher, even – and for some years to come. Manias occur when valuation no longer seems to matter, and caution is thrown completely to the wind – as buyers rush in to buy first, and ask questions later. Two manias in the last century – the “Roaring Twenties” of the 1920s, and the “Tech Bubble” of the late 1990s – show that the sky is the limit when common sense is overcome by a blind desire to buy. But, of course, the piper must be paid, and the following decade or two were spent in Secular Bear Markets, giving most or all of the mania-gains back.
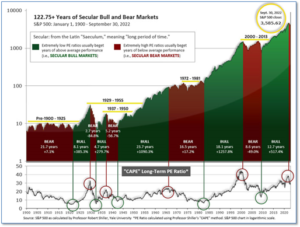
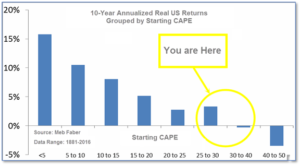
See Fig. 1 for the 100-year view of Secular Bulls and Bears. The CAPE is now at 28.09, down from the prior week’s 28.13. Since 1881, the average annual return for all ten-year periods that began with a CAPE in this range has been slightly positive to slightly negative (see Fig. 2).
Note: We do not use CAPE as an official input into our methods. However, if history is any guide – and history is typically ‘some’ kind of guide – it’s always good to simply know where we are on the historic continuum, where that may lead, and what sort of expectations one may wish to hold in order to craft an investment strategy that works in any market ‘season’ … whether the current one, or one that may be ‘coming soon’!
The Big Picture:
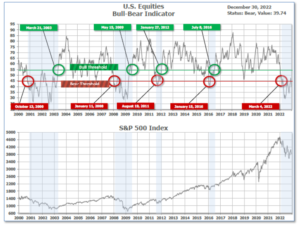
The ‘big picture’ is the (typically) years-long timeframe – the timeframe in which Cyclical Bulls and Bears operate. The U.S. Bull-Bear Indicator finished the week in Bear territory at 39.74, down from the prior week’s 41.84.
In the Quarterly- and Shorter-term Pictures
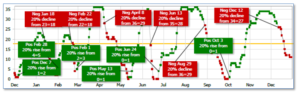
The Quarterly-Trend Indicator based on the combination of U.S. and International Equities trend-statuses at the start of each quarter – was Positive entering January, indicating positive prospects for equities in the first quarter of 2023.
Next, the short-term(weeks to months) Indicator for US Equities turned negative on December 12, and ended the week at 11, down from the prior week’s 12.
In the Markets:
U.S. Markets: The major U.S. indexes ended the week lower in a second week of light holiday trading. Consumer staples and materials shares fell the most, while the consumer discretionary sector remained resilient. The Dow Jones Industrial Average pulled back -0.2% to 33,147, while the technology-heavy NASDAQ Composite ended down -0.3% to 10,466. By market cap, the large cap S&P 500 ticked down a scant -0.1%, while the mid cap S&P 400 pulled back ‑0.2% and the small cap Russell 2000 finished the week essentially flat.
International Markets: International markets finished the week predominantly to the downside. Canada’s TSX retreated -0.6%, while the United Kingdom’s FTSE 100 ended down -0.3%. On Europe’s mainland, France’s CAC 40 and Germany’s DAX pulled back -0.5% and -0.1%, respectively. In Asia, China’s Shanghai Composite rebounded 1.4%, while Japan’s Nikkei ended down -0.5%. As grouped by Morgan Stanley Capital International, developed markets closed down ‑0.4% ad emerging markets added 0.3%.
Commodities: Commodities finished the last week of the year predominantly in the green. Precious metals finished in the green with Gold up 1.2% to $1826.20 per ounce, while Silver added 0.5% to $24.04. West Texas Intermediate crude added 0.9% to $80.26 per barrel, while the industrial metal copper, viewed by some analysts as a barometer of world economic health due to its wide variety of uses, ticked up 0.04%
December Markets Summary: December was a tough month for equities, but a good month for commodities. The Dow pulled back -4.2%, the NASDAQ composite dropped -8.7%. By market cap, large caps ended down -5.9%, mid caps declined -5.7% and small caps fell -6.6%. December was also a poor month for international equities. Canada and the UK pulled back ‑5.2% and -1.6%, respectively. France retraced -3.9%, while Germany gave up -3.3%. China and Japan ended the month down -2.0% and -6.7%. By grouping, developed markets closed out December down ‑1.8% and emerging markets ended down -2.6%. On the other hand, commodities were mostly positive in December. Silver surged 10.4%, followed by Gold which added 3.8%. Copper gained 1.9%, but crude oil pulled back -0.4%.
Fourth Quarter Markets Summary: Most of the major U.S. stock indexes managed meaningful recoveries in the fourth quarter. The Dow rallied the most, rebounding 15.4%, but the NASDAQ composite ended the quarter down -1%. Large caps added 7.1%, while mid caps rose 10.3% and small caps finished the quarter up 5.8%. Likewise, international equities finished the fourth quarter on solid footing. Canada rose 5.1%, while the UK rebounded 8.1%. France and Germany rallied 12.3% and 14.9%, respectively, while China added 2.1%. Japan finished up 0.6%. By grouping, developed markets rallied 17.7%, while emerging markets finished up 10.3%. Commodities, too, enjoyed a positive fourth quarter. Silver surged 26.3% while Gold added 9.2%. Crude rose 1% during the quarter, while copper jumped 11.7%.
2022 Markets Summary: Despite the fourth quarter rally, U.S. markets were down across the board for the year. The Dow finished down -8.8%–outperforming the NASDAQ composite by a wide margin, which finished 2022 down ‑33.1%. By market cap, large caps gave up -19.4%, mid caps pulled back ‑14.5%, and the Russell 2000 finished the year down ‑21.6%. International markets were also down for the year with the notable exception of the U.K. Canada gave up ‑8.7%, while the UK’s FTSE closed out 2022 up 0.9%. France ended the year down -9.5% along with Germany which gave up ‑12.3%. China finished the year down -15.1%. Japan closed the year down -9.4%. By grouping, developed markets ended 2022 down -14.4% and emerging markets finished the year down -20.6%. Major commodities finished the year mixed. Crude oil closed the year up 6.7%, followed by Silver up 3.0% but gold finished essentially flat down just ‑0.1%. The industrial metal Copper performed the worst, finishing the year down -14.6%.
U.S. Economic News: The number of Americans filing first-time unemployment rose slightly more than expected last week, but remained near historically low levels. The Labor Department reported initial jobless claims rose by 9,000 to 225,000. Economists had expected claims would rise by just 7,000. Meanwhile, the number of people already collecting benefits, known as ‘continuing claims’, rose by 41,000 to 1.71 million. That is the highest level since last February. Still, analysts don’t see enough cooling in the labor market to stop the Federal Reserve from continuing to raise interest rates. The Fed projects the unemployment rate to rise to 4.6% in 2023 from 3.7% in November, but it hasn’t budged so far. Thomas Simons, economist at Jefferies wrote in a note, “The labor market remains very tight. We expect it will soften eventually, but it is starting from a very significant position of strength and it will take a little while longer for the cracks to form.”
Home prices fell for a fourth consecutive month as higher mortgage rates continued to weigh on the nation’s homebuyers. S&P reported its Case-Shiller 20-city home price index fell 0.5% in October bringing the annual rate of price increase down to 8.6% from 10.4% in the previous month. Meanwhile, a broader measure of home prices, the national index, fell a seasonally adjusted 0.3% in October. In the report, Miami, Tampa, and Charlotte reported the highest year-over-year gains among the 20 cities. San Francisco and Seattle reported the worst annual gains, which have seen home prices fall by more than 10% from May. Craig J. Lazarra, managing director at S&P doesn’t anticipate an improvement in the real estate market anytime soon. Lazarra wrote, “As the Federal Reserve continues to move interest rates higher, mortgage financing continues to be a headwind for home prices. Given the continuing prospects for a challenging macroeconomic environment, prices may well continue to weaken,” he added.
The weakness in housing doesn’t appear likely to improve anytime soon, according to the National Association of Realtors (NAR). The NAR reported pending home sales, transactions in which a contract has been signed but not yet closed, fell -4% in November to its lowest level since April of 2020. Analysts had expected pending home sales to drop just -1.8%. From the same time last year, pending home sales have plunged -37.8%. Contract signings fell in all regions across the country. Pending home sales fell the most in the Northeast—down -7.9%, followed by the Midwest, the South and the West. Pending home sales have fallen in all but one month in 2022. George Ratiu, senior economist at Realtor.com summed up the report succinctly, “Housing markets have entered a winter freeze.”
Business activity in the ‘Windy City’ rebounded last month from lows not seen since the depths of the Great Financial Crisis. The Chicago Business Barometer rebounded to 44.9 in December from 37.2 in the prior month. Economists had expected a reading of 40.5. The manufacturing sector has been suffering from slow demand due to a weak global economy. Richard Moody, chief economist at Regions Financial Corp. wrote in a note to clients, “The next several months will be challenging for the manufacturing sector.” The Chicago Business Barometer report is the last of the regional manufacturing surveys before the national Institute for Supply Management data is released next week.
International Economic News: Statistics Canada reported Canadian job openings were down in October to their lowest level since late summer of 2021. Job vacancies fell by 44,300 to 871,300 in the latest report. Vacancies in the construction industry led the way with a 20.4% drop month-over-month. Statistics Canada says no sector recorded a statistically significant increase in its number of unfilled positions, although vacancies remained near record levels in health care and social assistance.
Across the Atlantic, U.K. Prime Minister Rishi Sunak blamed Covid and the war in Ukraine for what he described as a “tough” 12 months and warned that the country’s problems won’t disappear in 2023. In a video address Sunak stated, “Just as we recovered from an unprecedented global pandemic, Russia launched a barbaric and illegal invasion across Ukraine. This has had a profound economic impact around the world, which the UK is not immune to.” Keir Starmer, leader of the United Kingdom’s Labor party stated 2023 would be “a new chapter for Britain”. During 2023, Starmer said, Labor would “set out the case for change”, including more equal economic growth, a green jobs revolution and what he called “a completely new way of doing politics”.
Germany, Europe’s economic powerhouse, could become a ‘bankrupt state’ according to the Vice President of Germany’s federal parliament, the Bundestag. Wolfgang Kubicki said Germany could soon become a dysfunctional, bankrupt state if it stays on the same path it is currently on and fails to deal with the ongoing energy crisis in light of its imbalanced financial policies. According to the Parliament’s deputy speaker, the extra money Germany is currently planning to spend on energy imports from around the world outside of Russia would be withdrawn from other areas, as the surplus can be “neither printed on a money printing machine nor covered by taxpayers.” According to the Ifo Institute for Economic Research, the ongoing energy crisis as a result of the war in Ukraine is “wreaking havoc” on the German economy and they project it could lead to a -0.3% drop in GDP next year.
In Asia, manufacturing activity in China contracted further in November as the government enacted strict COVID 19-related curbs. Industrial profits fell -3.6% year-to-date through November, down from -3.0% in October, China’s National Bureau of Statistics reported. Zhu Hong, a senior NBS statistician, highlighted a rebound in COVID outbreaks and lackluster demand in November that curbed industrial production and placed increasing pressure on Chinese businesses. Analysts have noted China’s economy has been weighed down by anti-virus curbs in big manufacturing hubs such as Guangzhou and Zhengzhou, a protracted property crisis, and slowing exports.
Japan’s government will make raising wages a top priority in its economic policy next year, Deputy Chief Cabinet Secretary Seiji Kihara said in an interview this week. “The biggest challenge for Japan’s economy is a lack of wage growth. Unless wages rise, consumption won’t pick up and companies won’t increase investment,” Kihara said. Kihara added that while companies ultimately decide how much they will pay, the government can achieve higher wages through tax incentives. The remarks echo those of Bank of Japan (BOJ) Governor Haruhiko Kuroda, who has stressed that achieving higher wages would be crucial for the economy to sustainably achieve its 2% inflation target, driven by strong domestic demand. Prime Minister Fumio Kishida’s administration has seen approval ratings plunge due in part to worries over the rising cost of living.
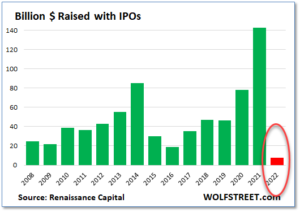
Finally: Investors that have spent any more than a few years in the markets are aware of boom-bust cycles. In the IPO (or ‘Initial Public Offering’) market, the boom-bust cycle has never been more pronounced than in the past two years. IPO’s hit their speculative high in February of 2021 as extraordinarily easy money policies fueled a boom. In 2021, almost 400 IPOs made it to market while this year that number collapsed to just 71. On the basis of money raised, the collapse has been even more stunning. The worst prior collapse was during the Financial Crisis in 2008 and 2009, yet even then three times as much money was raised via IPOs compared to 2022. From a sky-high $142 billion raised in 2021 to a puny $7.7 billion in 2022, the IPO market cratered by almost 95%. (Chart from Wolfstreet.com)
(Sources: All index- and returns-data from Yahoo Finance; news from Reuters, Barron’s, Wall St. Journal, Bloomberg.com, ft.com, guggenheimpartners.com, zerohedge.com, ritholtz.com, markit.com, financialpost.com, Eurostat, Statistics Canada, Yahoo! Finance, stocksandnews.com, marketwatch.com, wantchinatimes.com, BBC, 361capital.com, pensionpartners.com, cnbc.com, FactSet.) Content provided by WE Sherman and Company. Securities offered through Registered Representatives of Cambridge Investment Research Inc., a broker-dealer, member FINRA/SIPC. Advisory Services offered through Cambridge Investment Research Advisors, a Registered Investment Adviser. Strategic Investment Partners and Cambridge are not affiliated. Indices mentioned are unmanaged and cannot be invested into directly. Past performance is no guarantee of future results. These opinions of Strategic Investment Partners and not necessarily those of Cambridge Investment Research, are for informational purposes only and should not be construed or acted upon as individualized investment advice.